


Bitcoin (BTC) Price Predictions / Bitcoin (BTC) Forecast
| After | Price | Change |
|---|---|---|
| 1 day | $6,390.3734 | 0.67% |
| 1 week | $6,466.5679 | 1.88% |
| 1 month | $6,378.1574 | 0.48% |
| 6 months | $6,719.2533 | 5.86% |
| 1 year | $9,249.8266 | 45.72% |
| 5 years | $24,081.1609 | 279.38% |
The Stochastic Oscillator is a range bound momentum oscillator. Stochastic oscillator is showing Neutral signal, with value at 54.3.
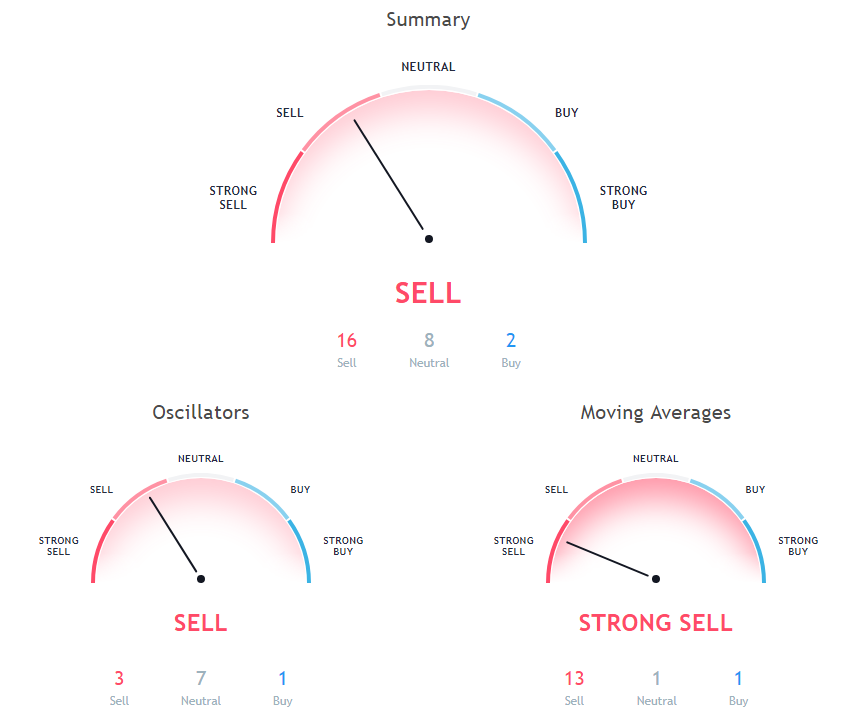
The Commodity Channel Index (CCI) is a momentum-based technical trading tool used to determine when a market is overbought or oversold. Commodity Channel Index is showing Neutral signal, with value at -16.9.
Relative Strength Index (RSI) is an important indicator that measures speed and change of price movements. Its value ranges between zero and 100. Value around 30 and below is considered oversold region and around 70 and above considered overbought regions. Relative Strength Index is showing Neutral signal, with value at 46.6.
Moving averages come in many forms, but their use remains the same: to help traders identify the trends of assets by smoothing out the day-to-day price fluctuations.
30 days Simple Moving Average is at 6508.2, showing Sell signal, Bitcoin is trading below it at $6347.54. 10 days Simple Moving Average is indicating Sell action with value at 6471.5, Bitcoin is trading below it at $6347.54. 20 days Exponential Moving Average is at 6467.4, showing Sell signal, Bitcoin is trading below it at $6347.54.
30 days Exponential Moving Average is indicating Sell since Bitcoin is trading at $6347.54, below MAs value of 6482.8. 9 days Hull Moving Average is at 6423.6, showing Buy signal, Bitcoin is trading below it at $6347.54. 50 days Simple Moving Average is indicating Sell action with value at 6518.8, Bitcoin is trading below it at $6347.54.
9 days Ichimoku Cloud Base Line is indicating Neutral action with value at 6451.5, Bitcoin is trading below it at $6347.54. 20 days Simple Moving Average is indicating Sell action with value at 6451.6, Bitcoin is trading below it at $6347.54. 50 days Exponential Moving Average is indicating Sell action with value at 6517.1, Bitcoin is trading below it at $6347.54.
100 days Simple Moving Average is indicating Sell since Bitcoin is trading at $6347.54, below MAs value of 6547.2. 200 days Exponential Moving Average is at 7021.7, showing Sell signal, Bitcoin is trading below it at $6347.54. 100 days Exponential Moving Average is indicating Sell action with value at 6658.7, Bitcoin is trading below it at $6347.54.
Also Read: Bitcoin Mining Pools
20 days Volume Weighted Moving Average is indicating Sell action with value at 6442.2, Bitcoin is trading below it at $6347.54. 200 days Simple Moving Average is indicating Sell action with value at 7022.4, Bitcoin is trading below it at $6347.54. 10 days Exponential Moving Average is indicating Sell since Bitcoin is trading at $6347.54, below MAs value of 6453.8.
Other Technical Price Analysis for today:
Ethereum (ETH) Price Faces Tough Resistance Near $209 Level - Ethereum Price Analysis - 13 Nov 2018
Ripple (XRP) Price Anticipates Short Term Bullish Trend Lines - Ripple Price Analysis - 13 Nov 2018

