


Ethereum (ETH) Price Predictions / Ethereum (ETH) Forecast
| After | Price | Change |
|---|---|---|
| 1 day | $209.1378 | 0.90% |
| 1 week | $209.3947 | 1.02% |
| 1 month | $210.8526 | 1.72% |
| 6 months | $298.1100 | 43.82% |
| 1 year | $478.8550 | 131.02% |
| 5 years | $1,598.4962 | 671.18% |
Relative Strength Index (RSI) is an important indicator that measures speed and change of price movements. Its value ranges between zero and 100. Value around 30 and below is considered oversold region and around 70 and above considered overbought regions. Relative Strength Index is indicating Neutral action, with value at 49.52.
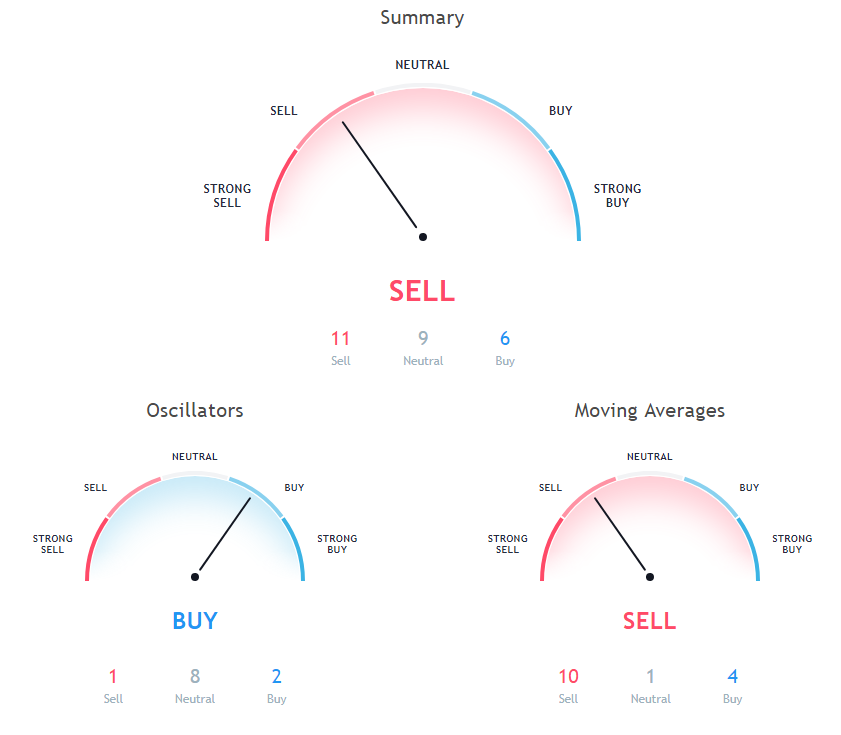
The Commodity Channel Index (CCI) is a momentum-based technical trading tool used to determine when a market is overbought or oversold. Commodity Channel Index is indicating Neutral action, with value at 28.97.
The stochastic oscillator is a momentum indicator that compares the closing price of a security with the price range over a specific period. Stochastic oscillator is indicating Neutral action, with value at 58.86.
10 days Exponential Moving Average is indicating Sell action with value at 211.3, Ethereum is trading below it at $207.28. 200 days Simple Moving Average is at 394.76, showing Sell signal, Ethereum is trading below it at $207.28. 10 days Simple Moving Average is indicating Sell action with value at 213.56, Ethereum is trading below it at $207.28.
9 days Ichimoku Cloud Base Line is at 209.08, showing Neutral signal, Ethereum is trading below it at $207.28. 50 days Exponential Moving Average is at 219.21, showing Sell signal, Ethereum is trading below it at $207.28. 9 days Hull Moving Average is indicating Sell since Ethereum is trading at $207.28, below MAs value of 211.22.
20 days Volume Weighted Moving Average is at 209.03, showing Buy signal, Ethereum is trading below it at $207.28. 100 days Simple Moving Average is indicating Sell since Ethereum is trading at $207.28, below MAs value of 239.76. 20 days Exponential Moving Average is at 210.1, showing Buy signal, Ethereum is trading below it at $207.28.
30 days Simple Moving Average is indicating Buy action with value at 207.84, Ethereum is trading below it at $207.28. 50 days Simple Moving Average is indicating Sell action with value at 212.73, Ethereum is trading below it at $207.28. 100 days Exponential Moving Average is indicating Sell action with value at 262.86, Ethereum is trading below it at $207.28.
Also Read: Ultimate Cryptocurrency Mining Guide
200 days Exponential Moving Average is indicating Sell action with value at 348.38, Ethereum is trading below it at $207.28. 20 days Simple Moving Average is indicating Buy since Ethereum is trading at $207.28, below MAs value of 207.44. 30 days Exponential Moving Average is indicating Sell action with value at 211.03, Ethereum is trading below it at $207.28.
Other Technical Price Analysis for today:
Bitcoin (BTC) Price See The Lowest Fall In Two Weeks - Bitcoin Price Analysis - 13 Nov 2018
Ripple (XRP) Price Anticipates Short Term Bullish Trend Lines - Ripple Price Analysis - 13 Nov 2018

