


The Head of Research at Fundstrat Global Advisors, Tom Lee recently stated his that the Bitcoin could surge to $25,000 by the end of 2018.
Technical analysis is done by analyzing data gathered from historical trading activity, such as volume, price movement, open, close etc.
Bitcoin (BTC) Price Predictions / Bitcoin (BTC) Forecast
| After | Price | Change |
|---|---|---|
| 1 day | $6,796.3362 | 0.93% |
| 1 week | $6,775.3520 | 0.61% |
| 1 month | $6,792.8262 | 0.87% |
| 6 months | $7,471.2601 | 10.95% |
| 1 year | $9,910.2591 | 47.17% |
| 5 years | $24,028.5539 | 256.82% |
We've applied Technical Analysis to the price of Bitcoin (BTC/USD) for today and predict where price is headed.
The Relative Strength Index (RSI) is an important indicator for measuring the speed and variation of price movements. Its value ranges from zero and 100. The value around 30 and below is considered an oversold region and over 70 as oversold regions. Relative Strength Index is indicating Neutral action, with value at 51.2.
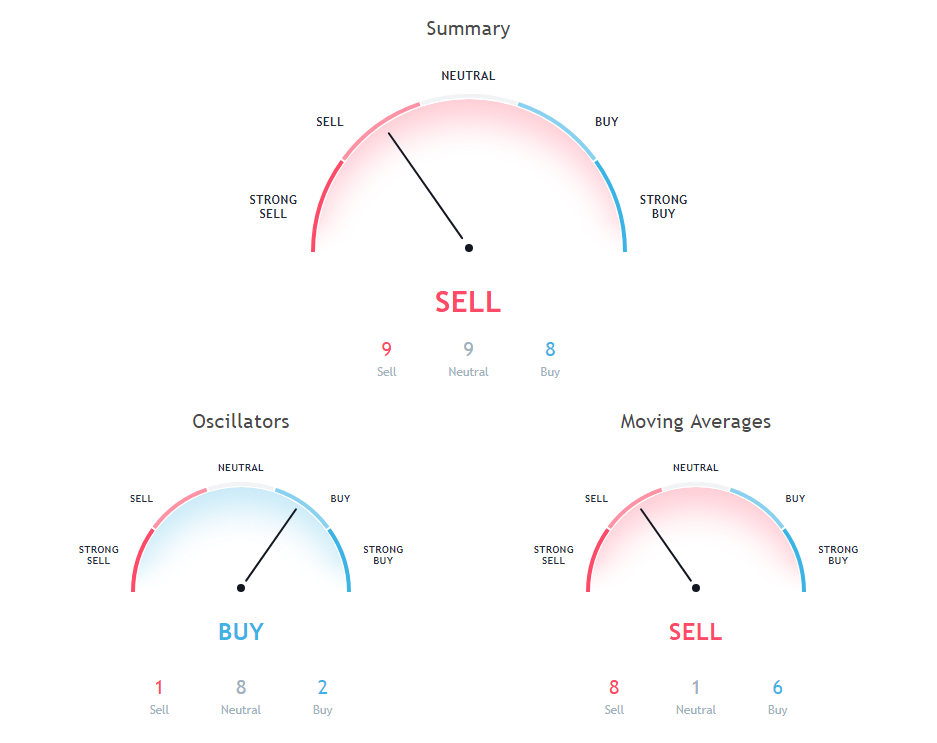
The Stochastic Oscillator is a range bound momentum oscillator. Stochastic oscillator is showing Neutral signal, with value at 82.8.
The Commodity Channel Index (CCI) is a momentum oscillator used in technical analysis to measure an instrument's deviation from its statistical average. Commodity Channel Index is at 119.5, indicating Neutral action.
Moving averages come in many forms, but their use remains the same: to help traders identify the trends of assets by smoothing out the day-to-day price fluctuations.
100 days Simple Moving Average is indicating Sell action with value at 6941.8, Bitcoin is trading below it at $6734. 50 days Exponential Moving Average is indicating Sell action with value at 6812.8, Bitcoin is trading below it at $6734. 200 days Exponential Moving Average is at 7579.5, showing Sell signal, Bitcoin is trading below it at $6734.
20 days Simple Moving Average is indicating Buy action with value at 6423.7, Bitcoin is trading below it at $6734. 20 days Volume Weighted Moving Average is at 6360.8, showing Buy signal, Bitcoin is trading below it at $6734. 30 days Simple Moving Average is indicating Sell since Bitcoin is trading at $6734, below MAs value of 6762.2.
50 days Simple Moving Average is indicating Sell action with value at 6939.3, Bitcoin is trading below it at $6734. 100 days Exponential Moving Average is indicating Sell action with value at 7138.9, Bitcoin is trading below it at $6734. 10 days Exponential Moving Average is indicating Buy since Bitcoin is trading at $6734, below MAs value of 6590.8.
Also Read: Beginners Guide to Binance Cryptocurrency Exchange - From Opening & Securing the Account to Trading
10 days Simple Moving Average is at 6535.5, showing Buy signal, Bitcoin is trading below it at $6734. 9 days Ichimoku Cloud Base Line is indicating Neutral since Bitcoin is trading at $6734, below MAs value of 6785.8. 9 days Hull Moving Average is indicating Sell action with value at 6799.1, Bitcoin is trading below it at $6734.
30 days Exponential Moving Average is at 6695.2, showing Buy signal, Bitcoin is trading below it at $6734. 200 days Simple Moving Average is at 7900.2, showing Sell signal, Bitcoin is trading below it at $6734. 20 days Exponential Moving Average is indicating Buy since Bitcoin is trading at $6734, below MAs value of 6621.3.

