


Ethereum (ETH) Price Predictions / Ethereum (ETH) Forecast
| After | Price | Change |
|---|---|---|
| 1 day | $212.6654 | 0.68% |
| 1 week | $214.1173 | 1.37% |
| 1 month | $212.0869 | 0.41% |
| 6 months | $300.1493 | 42.10% |
| 1 year | $479.6859 | 127.09% |
| 5 years | $1,600.2829 | 657.60% |
The Stochastic Oscillator is a range bound momentum oscillator. Stochastic oscillator is showing Neutral signal, with value at 61.75.
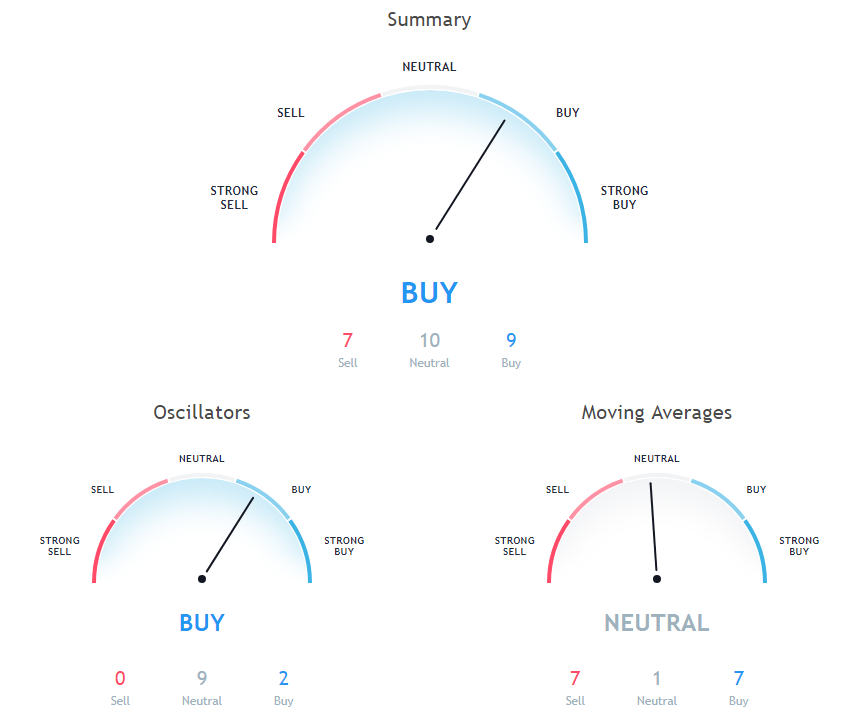
The Relative Strength Index (RSI) is an important indicator for measuring the speed and variation of price movements. Its value ranges from zero and 100. The value around 30 and below is considered an oversold region and over 70 as oversold regions. Relative Strength Index is showing Neutral signal, with value at 52.
The Commodity Channel Index (CCI) is a momentum oscillator used in technical analysis to measure an instrument's deviation from its statistical average. Commodity Channel Index is indicating Neutral action, with value at 56.97.
20 days Volume Weighted Moving Average is indicating Buy since Ethereum is trading at $211.23, below MAs value of 208.78. 9 days Ichimoku Cloud Base Line is at 209.08, showing Neutral signal, Ethereum is trading below it at $211.23. 10 days Simple Moving Average is at 212.55, showing Sell signal, Ethereum is trading below it at $211.23.
30 days Exponential Moving Average is indicating Buy since Ethereum is trading at $211.23, below MAs value of 211.07. 50 days Exponential Moving Average is at 219.57, showing Sell signal, Ethereum is trading below it at $211.23. 20 days Exponential Moving Average is indicating Buy action with value at 210.06, Ethereum is trading below it at $211.23.
10 days Exponential Moving Average is indicating Buy since Ethereum is trading at $211.23, below MAs value of 211.51. 30 days Simple Moving Average is indicating Buy action with value at 207.38, Ethereum is trading below it at $211.23. 100 days Simple Moving Average is at 241.75, showing Sell signal, Ethereum is trading below it at $211.23.
20 days Simple Moving Average is indicating Buy since Ethereum is trading at $211.23, below MAs value of 207.18. 50 days Simple Moving Average is indicating Sell since Ethereum is trading at $211.23, below MAs value of 213.08. 200 days Simple Moving Average is at 396.92, showing Sell signal, Ethereum is trading below it at $211.23.
Also Read: Send/Receive Ethereum in Ledger Nano S
100 days Exponential Moving Average is at 263.92, showing Sell signal, Ethereum is trading below it at $211.23. 9 days Hull Moving Average is indicating Buy action with value at 211.83, Ethereum is trading below it at $211.23. 200 days Exponential Moving Average is indicating Sell action with value at 349.76, Ethereum is trading below it at $211.23.
Other Technical Price Analysis for today:
Bitcoin (BTC) Price Trades In A Bearish Zone Below $6,400 - Bitcoin Price Analysis - 12 Nov 2018
Bitcoin Cash (BCH) Price Is Under Pressure Below $550 - Bitcoin Cash Price Analysis - 12 Nov 2018

