


Bitcoin Cash (BCH) Price Predictions / Bitcoin Cash (BCH) Forecast
| After | Price | Change |
|---|---|---|
| 1 day | $526.3906 | 0.20% |
| 1 week | $533.2092 | 1.50% |
| 1 month | $535.5212 | 1.94% |
| 6 months | $659.2592 | 25.49% |
| 1 year | $1,128.5817 | 114.83% |
| 5 years | $3,466.8524 | 559.94% |
The Stochastic Oscillator is a range bound momentum oscillator. Stochastic oscillator is indicating Neutral action, with value at 55.1.
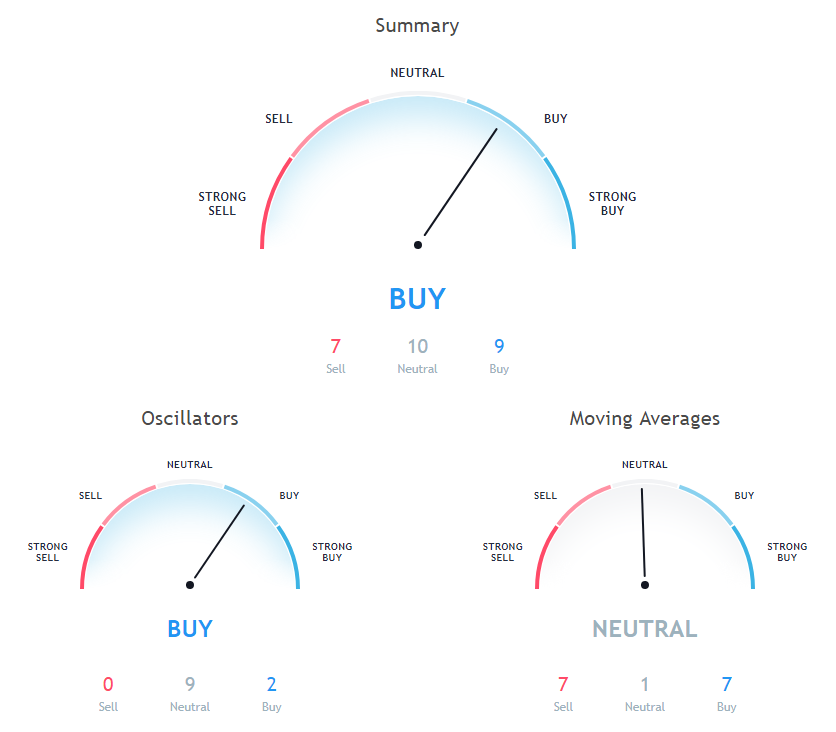
The Commodity Channel Index (CCI) is a momentum oscillator used in technical analysis to measure an instrument's deviation from its statistical average. Commodity Channel Index is indicating Neutral action, with value at 28.7.
Relative Strength Index (RSI) is an important indicator that measures speed and change of price movements. Its value ranges between zero and 100. Value around 30 and below is considered oversold region and around 70 and above considered overbought regions. Relative Strength Index is indicating Neutral action, with value at 53.1.
9 days Ichimoku Cloud Base Line is at 528.4, showing Neutral signal, Bitcoin Cash is trading below it at $525.33. 10 days Exponential Moving Average is at 540.7, showing Sell signal, Bitcoin Cash is trading below it at $525.33. 20 days Volume Weighted Moving Average is indicating Sell action with value at 552.3, Bitcoin Cash is trading below it at $525.33.
100 days Exponential Moving Average is indicating Sell since Bitcoin Cash is trading at $525.33, below MAs value of 557.3. 50 days Exponential Moving Average is indicating Buy since Bitcoin Cash is trading at $525.33, below MAs value of 507. 20 days Exponential Moving Average is at 519.3, showing Buy signal, Bitcoin Cash is trading below it at $525.33.
9 days Hull Moving Average is indicating Sell since Bitcoin Cash is trading at $525.33, below MAs value of 527.8. 200 days Exponential Moving Average is at 678.1, showing Sell signal, Bitcoin Cash is trading below it at $525.33. 30 days Exponential Moving Average is indicating Buy since Bitcoin Cash is trading at $525.33, below MAs value of 508.5.
200 days Simple Moving Average is indicating Sell since Bitcoin Cash is trading at $525.33, below MAs value of 755.1. 50 days Simple Moving Average is indicating Buy since Bitcoin Cash is trading at $525.33, below MAs value of 494.1. 30 days Simple Moving Average is at 485.1, showing Buy signal, Bitcoin Cash is trading below it at $525.33.
Also Read: Everything You Need to Know About the 15th Nov. Bitcoin Cash Hard Fork
100 days Simple Moving Average is at 512.9, showing Buy signal, Bitcoin Cash is trading below it at $525.33. 20 days Simple Moving Average is indicating Buy since Bitcoin Cash is trading at $525.33, below MAs value of 499.9. 10 days Simple Moving Average is indicating Sell since Bitcoin Cash is trading at $525.33, below MAs value of 561.7.
Other Technical Price Analysis for today:
Bitcoin (BTC) Price Trades In A Bearish Zone Below $6,400 - Bitcoin Price Analysis - 12 Nov 2018

