


Bitcoin (BTC) Price Predictions / Bitcoin (BTC) Forecast
| After | Price | Change |
|---|---|---|
| 1 day | $6,434.1675 | 0.32% |
| 1 week | $6,532.5493 | 1.86% |
| 1 month | $6,408.7107 | -0.07% |
| 6 months | $6,753.4806 | 5.30% |
| 1 year | $9,277.6481 | 44.66% |
| 5 years | $24,106.4883 | 275.87% |
The Commodity Channel Index (CCI) is a momentum oscillator used in technical analysis to measure an instrument's deviation from its statistical average. Commodity Channel Index is at -11.4, indicating Neutral action.
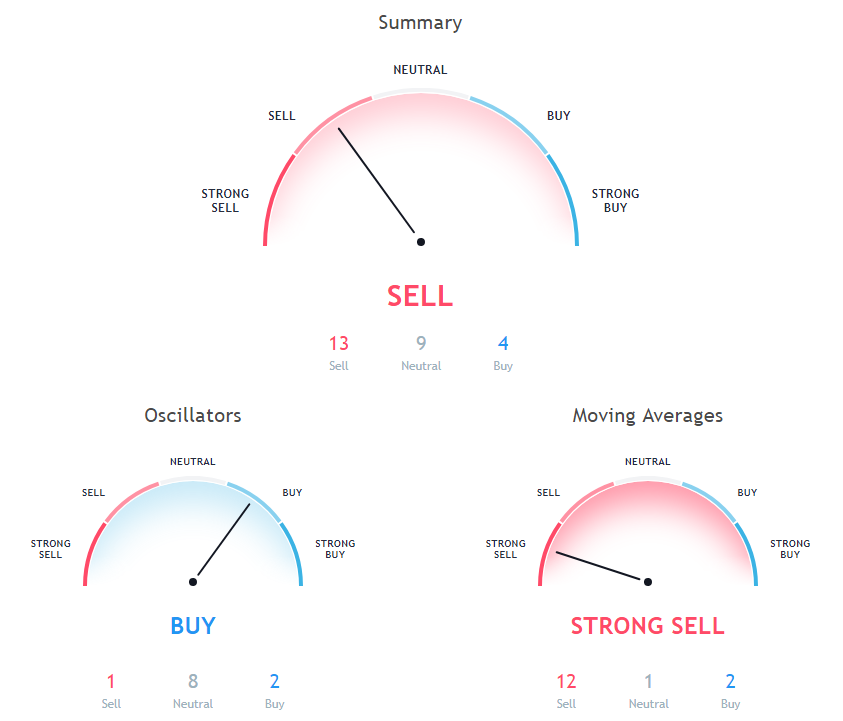
Relative Strength Index (RSI) is an important indicator that measures speed and change of price movements. Its value ranges between zero and 100. Value around 30 and below is considered oversold region and around 70 and above considered overbought regions. Relative Strength Index is at 47.3, indicating Neutral action.
The Stochastic Oscillator is a range bound momentum oscillator. Stochastic oscillator is indicating Neutral action, with value at 53.7.
50 days Exponential Moving Average is indicating Sell since Bitcoin is trading at $6413.48, below MAs value of 6520.3. 30 days Simple Moving Average is indicating Sell since Bitcoin is trading at $6413.48, below MAs value of 6504.8. 200 days Exponential Moving Average is indicating Sell since Bitcoin is trading at $6413.48, below MAs value of 7027.6.
9 days Hull Moving Average is at 6419.7, showing Buy signal, Bitcoin is trading below it at $6413.48. 30 days Exponential Moving Average is at 6485.9, showing Sell signal, Bitcoin is trading below it at $6413.48. 100 days Simple Moving Average is indicating Sell action with value at 6553.1, Bitcoin is trading below it at $6413.48.
9 days Ichimoku Cloud Base Line is at 6511, showing Neutral signal, Bitcoin is trading below it at $6413.48. 20 days Exponential Moving Average is indicating Sell since Bitcoin is trading at $6413.48, below MAs value of 6470.5. 50 days Simple Moving Average is at 6521.7, showing Sell signal, Bitcoin is trading below it at $6413.48.
20 days Simple Moving Average is at 6457.4, showing Sell signal, Bitcoin is trading below it at $6413.48. 20 days Volume Weighted Moving Average is indicating Buy action with value at 6447.6, Bitcoin is trading below it at $6413.48. 200 days Simple Moving Average is at 7034.9, showing Sell signal, Bitcoin is trading below it at $6413.48.
Also Read: How to Short Bitcoin?
100 days Exponential Moving Average is indicating Sell action with value at 6663.2, Bitcoin is trading below it at $6413.48. 10 days Simple Moving Average is indicating Sell action with value at 6466.7, Bitcoin is trading below it at $6413.48. 10 days Exponential Moving Average is at 6457.4, showing Sell signal, Bitcoin is trading below it at $6413.48.
Other Technical Price Analysis for today:
Bitcoin Cash (BCH) Price Is Under Pressure Below $550 - Bitcoin Cash Price Analysis - 12 Nov 2018

