


Ethereum (ETH) Price Predictions / Ethereum (ETH) Forecast
| After | Price | Change |
|---|---|---|
| 1 day | $92.3346 | 0.98% |
| 1 week | $92.0939 | 0.72% |
| 1 month | $95.9521 | 4.93% |
| 6 months | $167.8216 | 83.53% |
| 1 year | $380.2325 | 315.83% |
| 5 years | $1,466.9363 | 1,504.26% |
The Stochastic Oscillator is a range bound momentum oscillator. Stochastic oscillator is indicating Neutral action, with value at 23.09.
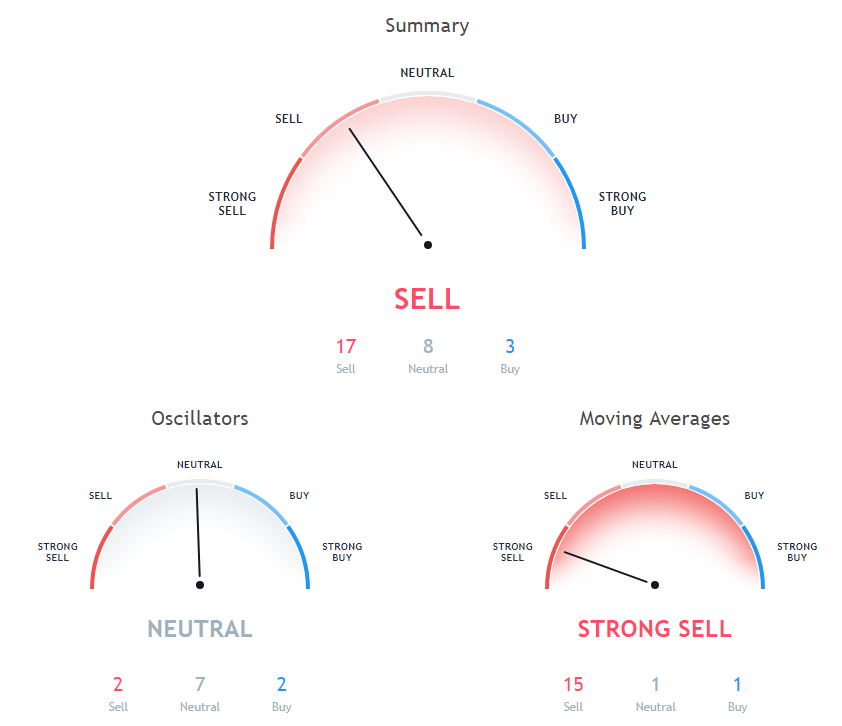
The Commodity Channel Index (CCI) is a momentum oscillator used in technical analysis to measure an instrument's deviation from its statistical average. Commodity Channel Index is at -132.71, indicating Buy action.
The Relative Strength Index (RSI) is an important indicator for measuring the speed and variation of price movements. Its value ranges from zero and 100. The value around 30 and below is considered an oversold region and over 70 as oversold regions. Relative Strength Index is at 25, indicating Buy action.
50 days Exponential Moving Average is at 155.23, showing Sell signal, Ethereum is trading below it at $91.44. 9 days Hull Moving Average is indicating Buy since Ethereum is trading at $91.44, below MAs value of 88.12. 5 days Simple Moving Average is indicating Sell action with value at 95.07, Ethereum is trading below it at $91.44.
20 days Simple Moving Average is at 113.4, showing Sell signal, Ethereum is trading below it at $91.44. 100 days Simple Moving Average is indicating Sell since Ethereum is trading at $91.44, below MAs value of 194.17. 9 days Ichimoku Cloud Base Line is at 147.2, showing Neutral signal, Ethereum is trading below it at $91.44.
30 days Simple Moving Average is indicating Sell action with value at 139.02, Ethereum is trading below it at $91.44. 10 days Exponential Moving Average is indicating Sell since Ethereum is trading at $91.44, below MAs value of 103.36. 5 days Exponential Moving Average is indicating Sell since Ethereum is trading at $91.44, below MAs value of 96.49.
200 days Exponential Moving Average is indicating Sell action with value at 297.42, Ethereum is trading below it at $91.44. 50 days Simple Moving Average is at 165.91, showing Sell signal, Ethereum is trading below it at $91.44. 30 days Exponential Moving Average is at 132.71, showing Sell signal, Ethereum is trading below it at $91.44.
10 days Simple Moving Average is at 104.58, showing Sell signal, Ethereum is trading below it at $91.44. 20 days Volume Weighted Moving Average is indicating Sell since Ethereum is trading at $91.44, below MAs value of 115.12. 200 days Simple Moving Average is at 319.01, showing Sell signal, Ethereum is trading below it at $91.44.
Also Read: 10 Best Ethereum Wallets of 2018
20 days Exponential Moving Average is at 118.68, showing Sell signal, Ethereum is trading below it at $91.44. 100 days Exponential Moving Average is at 206.51, showing Sell signal, Ethereum is trading below it at $91.44.
Other Technical Price Analysis for today:
Bitcoin (BTC) Price Consolidates Losses Above $3,200 - Bitcoin Price Analysis - 9 Dec 2018
Bitcoin Cash (BCH) Price Fell Sharply Below $110 - Bitcoin Cash Price Analysis - 9 Dec 2018

