


Bitcoin (BTC) Price Predictions / Bitcoin (BTC) Forecast
| After | Price | Change |
|---|---|---|
| 1 day | $3,501.0207 | 0.44% |
| 1 week | $3,513.9902 | 0.81% |
| 1 month | $3,568.4259 | 2.37% |
| 6 months | $4,055.3960 | 16.34% |
| 1 year | $6,295.5403 | 80.60% |
| 5 years | $21,186.7121 | 507.80% |
Relative Strength Index (RSI) is an important indicator that measures speed and change of price movements. Its value ranges between zero and 100. Value around 30 and below is considered oversold region and around 70 and above considered overbought regions. Relative Strength Index is showing Neutral signal, with value at 27.4.
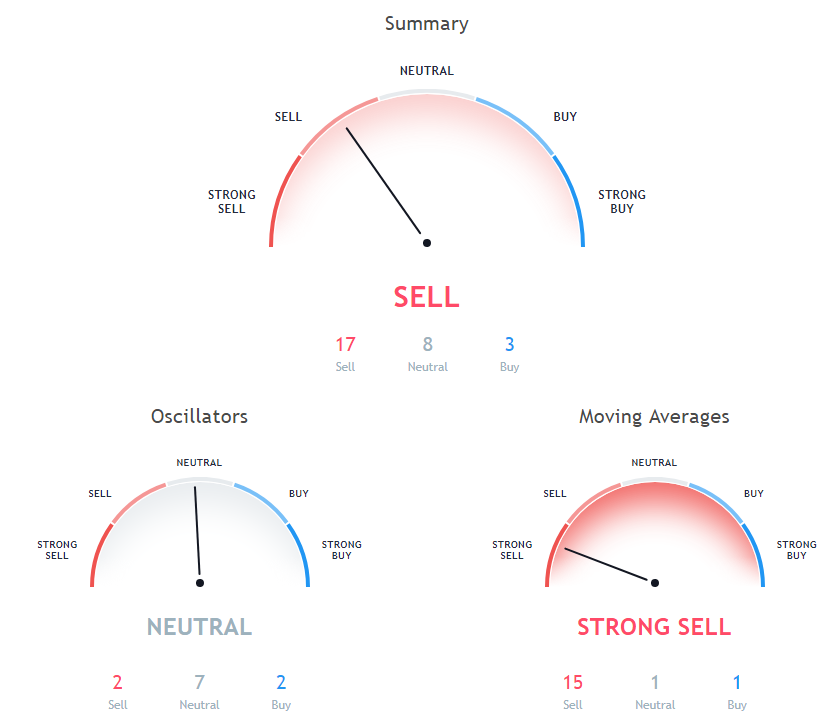
The Commodity Channel Index (CCI) is a momentum-based technical trading tool used to determine when a market is overbought or oversold. Commodity Channel Index is showing Buy signal, with value at -114.3.
The stochastic oscillator is a momentum indicator that compares the closing price of a security with the price range over a specific period. Stochastic oscillator is indicating Neutral action, with value at 18.
100 days Simple Moving Average is at 5983.8, showing Sell signal, Bitcoin is trading below it at $3485.81. 20 days Volume Weighted Moving Average is indicating Sell since Bitcoin is trading at $3485.81, below MAs value of 4058.6. 200 days Exponential Moving Average is at 6407.6, showing Sell signal, Bitcoin is trading below it at $3485.81.
100 days Exponential Moving Average is at 5698.8, showing Sell signal, Bitcoin is trading below it at $3485.81. 9 days Hull Moving Average is indicating Buy action with value at 3358.9, Bitcoin is trading below it at $3485.81. 9 days Ichimoku Cloud Base Line is at 4881.7, showing Neutral signal, Bitcoin is trading below it at $3485.81.
10 days Simple Moving Average is at 3813.4, showing Sell signal, Bitcoin is trading below it at $3485.81. 30 days Simple Moving Average is at 4662.5, showing Sell signal, Bitcoin is trading below it at $3485.81. 50 days Exponential Moving Average is indicating Sell action with value at 5019.2, Bitcoin is trading below it at $3485.81.
50 days Simple Moving Average is at 5388.1, showing Sell signal, Bitcoin is trading below it at $3485.81. 5 days Exponential Moving Average is indicating Sell since Bitcoin is trading at $3485.81, below MAs value of 3598.1. 20 days Simple Moving Average is at 4027.6, showing Sell signal, Bitcoin is trading below it at $3485.81.
20 days Exponential Moving Average is indicating Sell action with value at 4161.5, Bitcoin is trading below it at $3485.81. 200 days Simple Moving Average is at 6442.4, showing Sell signal, Bitcoin is trading below it at $3485.81. 10 days Exponential Moving Average is indicating Sell action with value at 3774.4, Bitcoin is trading below it at $3485.81.
Also Read: List of Best Bitcoin Lending Sites - (Bitcoin P2P loans)
5 days Simple Moving Average is indicating Sell since Bitcoin is trading at $3485.81, below MAs value of 3559.4. 30 days Exponential Moving Average is at 4513.7, showing Sell signal, Bitcoin is trading below it at $3485.81.
Other Technical Price Analysis for today:
Ethereum (ETH) Price Remains In A Downtrend - Ethereum Price Analysis - 9 Dec 2018
Bitcoin Cash (BCH) Price Fell Sharply Below $110 - Bitcoin Cash Price Analysis - 9 Dec 2018

