


Bitcoin (BTC) Price Predictions / Bitcoin (BTC) Forecast
| After | Price | Change |
|---|---|---|
| 1 day | $6,783.5047 | 0.69% |
| 1 week | $6,825.0377 | 1.31% |
| 1 month | $6,558.3120 | -2.65% |
| 6 months | $7,114.3631 | 5.60% |
| 1 year | $9,512.9616 | 41.20% |
| 5 years | $23,964.4012 | 255.71% |
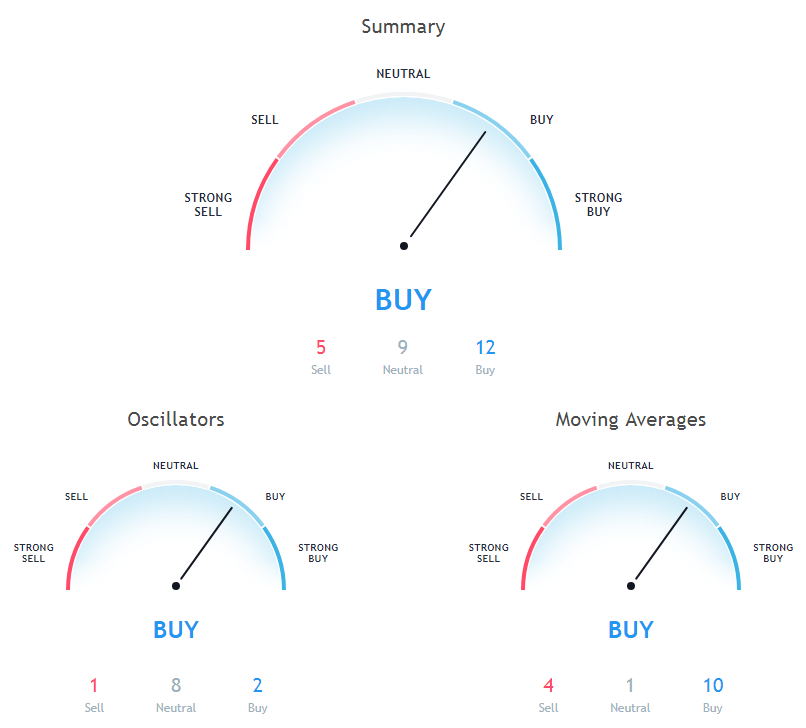
We've applied Technical Analysis to the price of Bitcoin (BTC/USD) for today and predict where price is headed.
The Commodity Channel Index (CCI) is a momentum oscillator used in technical analysis to measure an instrument's deviation from its statistical average. Commodity Channel Index is at 44.9, indicating Neutral action.
The Relative Strength Index (RSI) is an important indicator for measuring the speed and variation of price movements. Its value ranges from zero and 100. The value around 30 and below is considered an oversold region and over 70 as oversold regions. Relative Strength Index is showing Neutral signal, with value at 55.1.
The stochastic oscillator is a momentum indicator that compares the closing price of a security with the price range over a specific period. Stochastic oscillator is at 74.3, indicating Neutral action.
Moving Average (MA) is just average of any subset of numbers. For example, to calculate a basic 10-day moving average you would add up the closing prices from the past 10 days and then divide the result by 10.
9 days Hull Moving Average is indicating Buy action with value at 6498.1, Bitcoin is trading below it at $6736.99. 30 days Simple Moving Average is at 6665.8, showing Buy signal, Bitcoin is trading below it at $6736.99. 50 days Exponential Moving Average is indicating Buy since Bitcoin is trading at $6736.99, below MAs value of 6674.3.
100 days Exponential Moving Average is indicating Sell since Bitcoin is trading at $6736.99, below MAs value of 6937.4. 100 days Simple Moving Average is indicating Sell since Bitcoin is trading at $6736.99, below MAs value of 6743.4. 10 days Exponential Moving Average is at 6487.9, showing Buy signal, Bitcoin is trading below it at $6736.99.
50 days Simple Moving Average is indicating Buy since Bitcoin is trading at $6736.99, below MAs value of 6603.8. 200 days Exponential Moving Average is indicating Sell action with value at 7372.8, Bitcoin is trading below it at $6736.99. 10 days Simple Moving Average is indicating Buy action with value at 6451.4, Bitcoin is trading below it at $6736.99.
Also Read: What will be the Future of Cryptocurrencies?
30 days Exponential Moving Average is at 6582.9, showing Buy signal, Bitcoin is trading below it at $6736.99. 20 days Simple Moving Average is indicating Buy since Bitcoin is trading at $6736.99, below MAs value of 6554.4. 20 days Exponential Moving Average is indicating Buy since Bitcoin is trading at $6736.99, below MAs value of 6531.
200 days Simple Moving Average is at 7466.4, showing Sell signal, Bitcoin is trading below it at $6736.99. 20 days Volume Weighted Moving Average is indicating Buy since Bitcoin is trading at $6736.99, below MAs value of 6615.5. 9 days Ichimoku Cloud Base Line is indicating Neutral action with value at 6764.6, Bitcoin is trading below it at $6736.99.
Other Technical Price Analysis for today:
Ripple (XRP/USD) Price Prediction via Technical Analysis for 21 September 2018
Stellar (XLM/USD) Price Prediction via Technical Analysis for 21 September 2018
Cardano (ADA/USD) Price Prediction via Technical Analysis for 21 September 2018

