


Bitcoin (BTC) Price Predictions / Bitcoin (BTC) Forecast
| After | Price | Change |
|---|---|---|
| 1 day | $6,440.5776 | 0.45% |
| 1 week | $6,436.9846 | 0.40% |
| 1 month | $6,715.6224 | 4.74% |
| 6 months | $7,284.6471 | 13.62% |
| 1 year | $9,790.0181 | 52.70% |
| 5 years | $24,046.8589 | 275.06% |
We've applied Technical Analysis to the price of Bitcoin (BTC/USD) for today and predict where price is headed.
The Relative Strength Index (RSI) is an important indicator for measuring the speed and variation of price movements. Its value ranges from zero and 100. The value around 30 and below is considered an oversold region and over 70 as oversold regions. Relative Strength Index is indicating Neutral action, with value at 39.9.
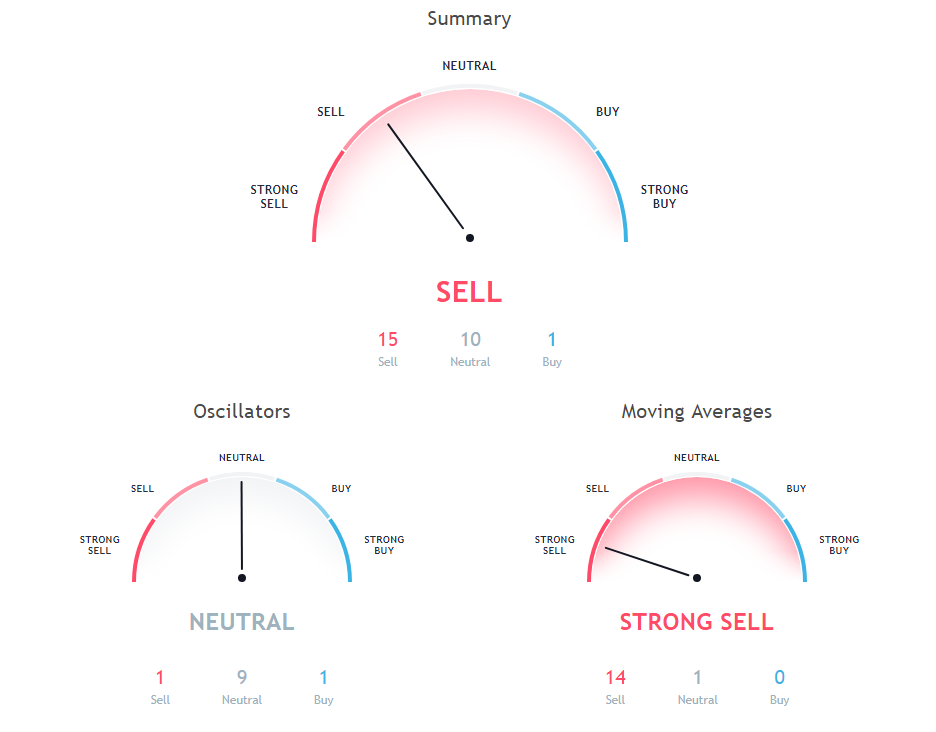
The Commodity Channel Index (CCI) is a momentum-based technical trading tool used to determine when a market is overbought or oversold. Commodity Channel Index is indicating Neutral action, with value at -85.5.
The stochastic oscillator is a momentum indicator that compares the closing price of a security with the price range over a specific period. Stochastic oscillator is showing Neutral signal, with value at 45.5.
200 days Simple Moving Average is indicating Sell action with value at 7784, Bitcoin is trading below it at $6411.42. 20 days Volume Weighted Moving Average is indicating Sell action with value at 6765.8, Bitcoin is trading below it at $6411.42. 100 days Simple Moving Average is indicating Sell since Bitcoin is trading at $6411.42, below MAs value of 6880.6.
20 days Simple Moving Average is indicating Sell action with value at 6795.2, Bitcoin is trading below it at $6411.42. 200 days Exponential Moving Average is indicating Sell action with value at 7529.2, Bitcoin is trading below it at $6411.42. 100 days Exponential Moving Average is at 7122.3, showing Sell signal, Bitcoin is trading below it at $6411.42.
50 days Simple Moving Average is indicating Sell since Bitcoin is trading at $6411.42, below MAs value of 7033.5. 10 days Exponential Moving Average is indicating Sell since Bitcoin is trading at $6411.42, below MAs value of 6910.4. 30 days Simple Moving Average is indicating Sell action with value at 6634.1, Bitcoin is trading below it at $6411.42.
30 days Exponential Moving Average is at 6856.7, showing Sell signal, Bitcoin is trading below it at $6411.42. 10 days Simple Moving Average is at 7035.9, showing Sell signal, Bitcoin is trading below it at $6411.42. 9 days Hull Moving Average is at 6867.1, showing Sell signal, Bitcoin is trading below it at $6411.42.
Also Read: List of places accepting Bitcoins and Ethereum
9 days Ichimoku Cloud Base Line is indicating Neutral action with value at 6643.9, Bitcoin is trading below it at $6411.42. 20 days Exponential Moving Average is indicating Sell action with value at 6868.1, Bitcoin is trading below it at $6411.42. 50 days Exponential Moving Average is at 6887.3, showing Sell signal, Bitcoin is trading below it at $6411.42.
Other Technical Price Analysis for today:
Ripple (XRP/USD) Price Prediction via Technical Analysis for 06 September 2018
Ethereum (ETH/USD) Price Prediction via Technical Analysis for 06 September 2018
Cardano (ADA/USD) Price Prediction via Technical Analysis for 06 September 2018

