


Ethereum (ETH) Price Predictions / Ethereum (ETH) Forecast
| After | Price | Change |
|---|---|---|
| 1 day | $225.9736 | 0.14% |
| 1 week | $227.5453 | 0.84% |
| 1 month | $230.1730 | 2.00% |
| 6 months | $309.4749 | 37.15% |
| 1 year | $477.2536 | 111.50% |
| 5 years | $1,656.7955 | 634.23% |
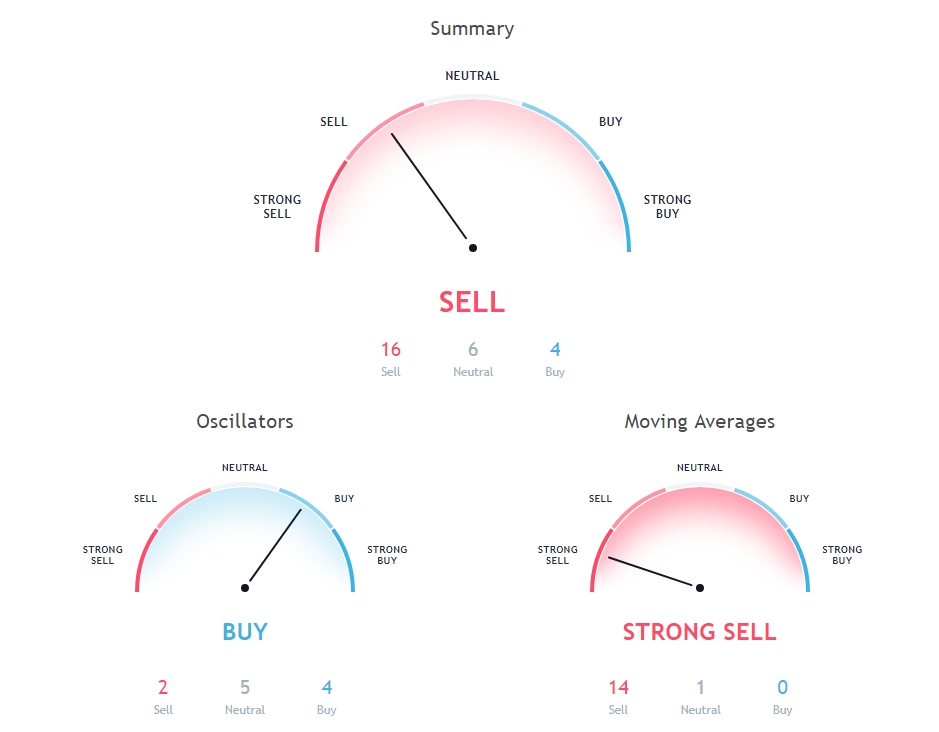
We've applied Technical Analysis to the price of Ethereum (ETH/USD) for today and predict where price is headed.
The Commodity Channel Index (CCI) is a momentum oscillator used in technical analysis to measure an instrument's deviation from its statistical average. Commodity Channel Index is at -271.14, indicating Buy action.
The Relative Strength Index (RSI) is an important indicator for measuring the speed and variation of price movements. Its value ranges from zero and 100. The value around 30 and below is considered an oversold region and over 70 as oversold regions. Relative Strength Index is showing Buy signal, with value at 26.6.
The stochastic oscillator is a momentum indicator that compares the closing price of a security with the price range over a specific period. Stochastic oscillator is showing Neutral signal, with value at 26.56.
Moving Average (MA) in simple term is just average of any subset of numbers. For example, 50 Days simple moving average is calculated at any point in chart by summing past 50 days of price and then dividing it by 50.
9 days Hull Moving Average is at 244.23, showing Sell signal, Ethereum is trading below it at $225.65. 30 days Simple Moving Average is indicating Sell action with value at 290.59, Ethereum is trading below it at $225.65. 20 days Exponential Moving Average is indicating Sell since Ethereum is trading at $225.65, below MAs value of 284.7.
30 days Exponential Moving Average is indicating Sell since Ethereum is trading at $225.65, below MAs value of 302.93. 50 days Exponential Moving Average is indicating Sell since Ethereum is trading at $225.65, below MAs value of 338.89. 10 days Simple Moving Average is at 276.99, showing Sell signal, Ethereum is trading below it at $225.65.
100 days Simple Moving Average is at 425.84, showing Sell signal, Ethereum is trading below it at $225.65. 200 days Exponential Moving Average is indicating Sell since Ethereum is trading at $225.65, below MAs value of 480.84. 100 days Exponential Moving Average is indicating Sell since Ethereum is trading at $225.65, below MAs value of 410.76.
20 days Simple Moving Average is indicating Sell since Ethereum is trading at $225.65, below MAs value of 279.15. 10 days Exponential Moving Average is indicating Sell action with value at 268.13, Ethereum is trading below it at $225.65. 50 days Simple Moving Average is indicating Sell action with value at 351.18, Ethereum is trading below it at $225.65.
Also Read: Best Ethereum Wallets
20 days Volume Weighted Moving Average is at 270.72, showing Sell signal, Ethereum is trading below it at $225.65. 9 days Ichimoku Cloud Base Line is indicating Neutral since Ethereum is trading at $225.65, below MAs value of 269.56. 200 days Simple Moving Average is at 529.73, showing Sell signal, Ethereum is trading below it at $225.65.
Other Technical Price Analysis for today:
Bitcoin (BTC/USD) Price Prediction via Technical Analysis for 06 September 2018
Ripple (XRP/USD) Price Prediction via Technical Analysis for 06 September 2018
Cardano (ADA/USD) Price Prediction via Technical Analysis for 06 September 2018

