


Bitcoin Cash (BCH) Price Predictions / Bitcoin Cash (BCH) Forecast
| After | Price | Change |
|---|---|---|
| 1 day | $546.5694 | 0.22% |
| 1 week | $552.2074 | 1.25% |
| 1 month | $577.9076 | 5.96% |
| 6 months | $734.9711 | 34.76% |
| 1 year | $1,168.9960 | 114.35% |
| 5 years | $3,597.1462 | 559.57% |
As per recent reports, a UK-based cryptocurrency futures exchange - Crypto Facilities, has introduced the first-ever Bitcoin Cash futures contract. So we've applied Technical Analysis to the price of Bitcoin Cash (BCH/USD) for today and let's predict where price is headed.
The stochastic oscillator is a momentum indicator that compares the closing price of a security with the price range over a specific period. Stochastic oscillator is indicating Neutral action, with value at 34.8.
The Relative Strength Index (RSI) is an important indicator for measuring the speed and variation of price movements. Its value ranges from zero and 100. The value around 30 and below is considered an oversold region and over 70 as oversold regions. Relative Strength Index is showing Neutral signal, with value at 37.9.
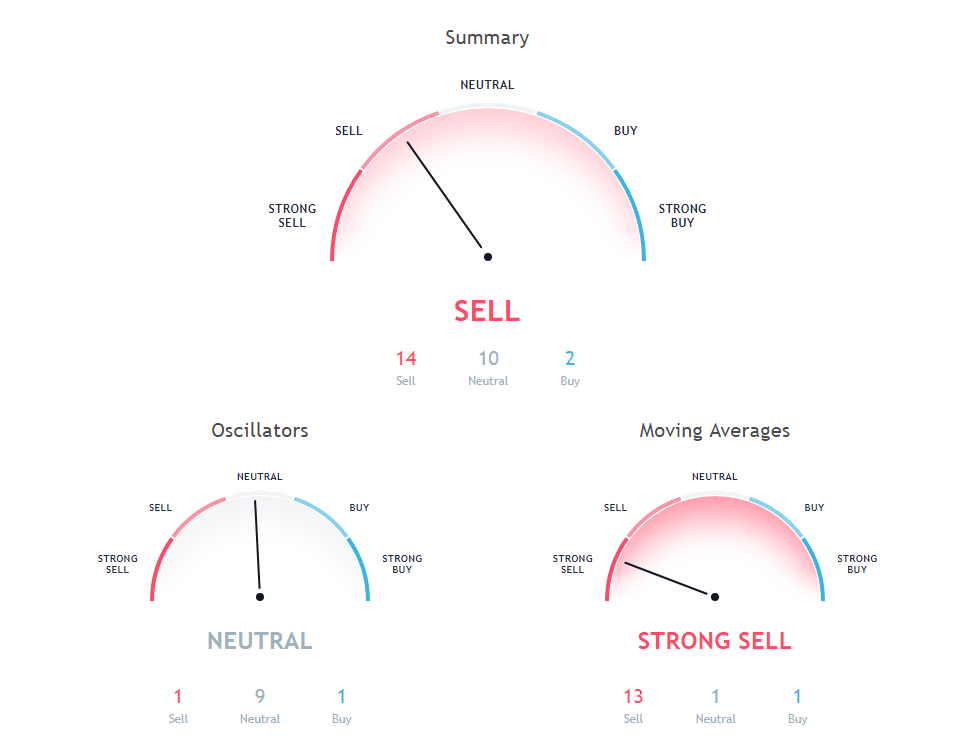
The Commodity Channel Index (CCI) is a momentum-based technical trading tool used to determine when a market is overbought or oversold. Commodity Channel Index is showing Neutral signal, with value at -63.
9 days Ichimoku Cloud Base Line is indicating Neutral action with value at 667.1, Bitcoin Cash is trading below 9 days Ichimoku Cloud Base Line at $545.38. 20 days Volume Weighted Moving Average is indicating Sell since Bitcoin Cash is trading at $545.38, below 20 days Volume Weighted Moving Average value of 598.2. 10 days Simple Moving Average is indicating Sell action with value at 547.5, Bitcoin Cash is trading below 10 days Simple Moving Average at $545.38.
100 days Exponential Moving Average is at 819.2, showing Sell signal. Current price $545.38 of Bitcoin Cash is below 100 days Exponential Moving Average. 30 days Simple Moving Average is at 678.5, showing Sell signal. Current price $545.38 of Bitcoin Cash is below 30 days Simple Moving Average. 50 days Simple Moving Average is at 708.7, showing Sell signal. Current price $545.38 of Bitcoin Cash is below 50 days Simple Moving Average.
9 days Hull Moving Average is indicating Sell since Bitcoin Cash is trading at $545.38, below 9 days Hull Moving Average value of 574.2. 20 days Simple Moving Average is indicating Sell since Bitcoin Cash is trading at $545.38, below 20 days Simple Moving Average value of 610.9. 200 days Exponential Moving Average is at 915.3, showing Sell signal. Current price $545.38 of Bitcoin Cash is below 200 days Exponential Moving Average.
Also Read: Best Cryptocurrency Exchanges
20 days Exponential Moving Average is indicating Sell since Bitcoin Cash is trading at $545.38, below 20 days Exponential Moving Average value of 607.7. 50 days Exponential Moving Average is at 702, showing Sell signal. Current price $545.38 of Bitcoin Cash is below 50 days Exponential Moving Average. 100 days Simple Moving Average is indicating Sell action with value at 849.3, Bitcoin Cash is trading below 100 days Simple Moving Average at $545.38.
10 days Exponential Moving Average is at 565.9, showing Sell signal. Current price $545.38 of Bitcoin Cash is below 10 days Exponential Moving Average. 30 days Exponential Moving Average is indicating Sell since Bitcoin Cash is trading at $545.38, below 30 days Exponential Moving Average value of 643.4. 200 days Simple Moving Average is at 984.8, showing Sell signal. Current price $545.38 of Bitcoin Cash is below 200 days Simple Moving Average.
Other Technical Price Analysis for today:
Bitcoin (BTC/USD) Price Prediction via Technical Analysis for 20 August 2018
Stellar (XLM/USD) Price Prediction via Technical Analysis for 20 August 2018
Binance Coin (BNB/USD) Price Prediction via Technical Analysis for 20 August 2018

