


Stellar (XLM) Price Predictions / Stellar (XLM) Forecast
| After | Price | Change |
|---|---|---|
| 1 day | $0.2238 | 0.20% |
| 1 week | $0.2256 | 1.00% |
| 1 month | $0.2295 | 2.71% |
| 6 months | $0.2661 | 19.12% |
| 1 year | $0.3939 | 76.33% |
| 5 years | $1.0755 | 381.44% |
Iit was been reported that Facebook’s blockchain research division has recently had a meeting with Stellar. So we've applied Technical Analysis to the price of Stellar (XLM/USD) for today and predict where price is headed.
The Stochastic Oscillator is a range bound momentum oscillator. Stochastic oscillator is indicating Neutral action, with value at 58.5913.
The Commodity Channel Index (CCI) is a momentum-based technical trading tool used to determine when a market is overbought or oversold. Commodity Channel Index is indicating Neutral action, with value at -41.278522.
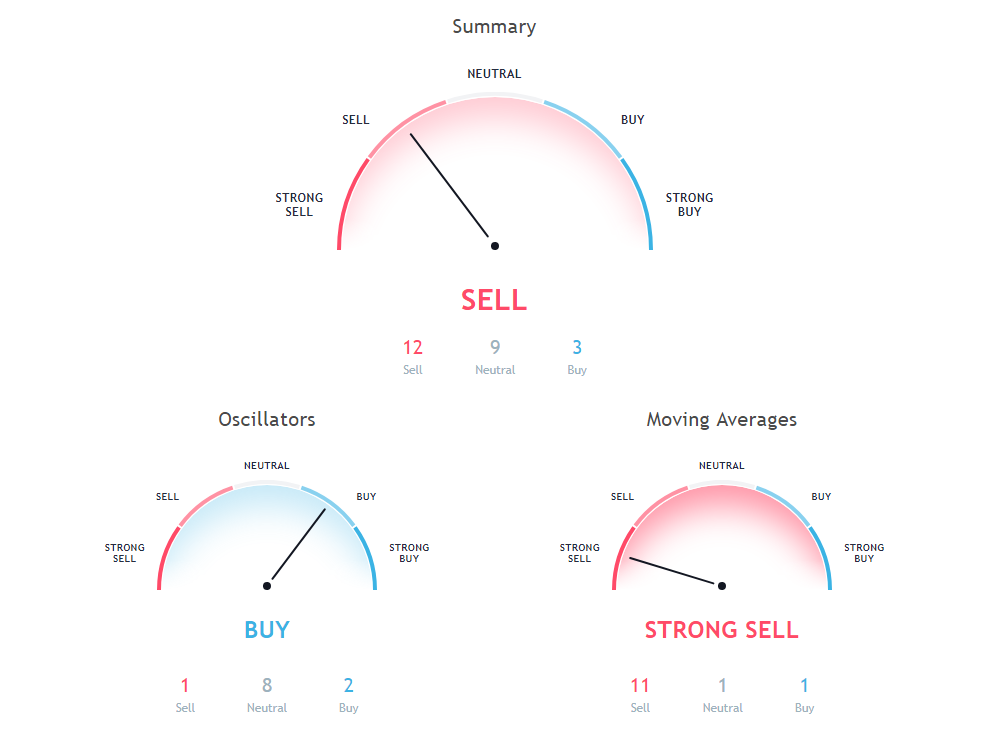
The Relative Strength Index (RSI) is an important indicator for measuring the speed and variation of price movements. Its value ranges from zero and 100. The value around 30 and below is considered an oversold region and over 70 as oversold regions. Relative Strength Index is indicating Neutral action, with value at 44.3271.
50 days Simple Moving Average is at 0.24287356, showing Sell signal. Current price $0.2234 of Stellar is below 50 days Simple Moving Average. 200 days Simple Moving Average is at 0, showing — signal. Current price $0.2234 of Stellar is below 200 days Simple Moving Average. 100 days Exponential Moving Average is indicating Sell action with value at 0.2625877, Stellar is trading below 100 days Exponential Moving Average at $0.2234.
9 days Hull Moving Average is at 0.23011558, showing Sell signal. Current price $0.2234 of Stellar is below 9 days Hull Moving Average. 10 days Exponential Moving Average is indicating Sell action with value at 0.22575891, Stellar is trading below 10 days Exponential Moving Average at $0.2234. 20 days Simple Moving Average is indicating Sell action with value at 0.2301428, Stellar is trading below 20 days Simple Moving Average at $0.2234.
30 days Simple Moving Average is indicating Sell since Stellar is trading at $0.2234, below 30 days Simple Moving Average value of 0.2541912. 100 days Simple Moving Average is at 0.25262865, showing Sell signal. Current price $0.2234 of Stellar is below 100 days Simple Moving Average. 200 days Exponential Moving Average is at 0, showing — signal. Current price $0.2234 of Stellar is below 200 days Exponential Moving Average.
50 days Exponential Moving Average is at 0.24497388, showing Sell signal. Current price $0.2234 of Stellar is below 50 days Exponential Moving Average. 20 days Volume Weighted Moving Average is indicating Sell action with value at 0.22985809, Stellar is trading below 20 days Volume Weighted Moving Average at $0.2234. 9 days Ichimoku Cloud Base Line is at 0.272045, showing Neutral signal. Current price $0.2234 of Stellar is below 9 days Ichimoku Cloud Base Line.
Also Read: Uses of Cryptocurrencies
10 days Simple Moving Average is indicating Sell since Stellar is trading at $0.2234, below 10 days Simple Moving Average value of 0.222413. 20 days Exponential Moving Average is indicating Sell since Stellar is trading at $0.2234, below 20 days Exponential Moving Average value of 0.23297247. 30 days Exponential Moving Average is indicating Sell action with value at 0.23771985, Stellar is trading below 30 days Exponential Moving Average at $0.2234.
Other Technical Price Analysis for today:
Bitcoin (BTC/USD) Price Prediction via Technical Analysis for 20 August 2018
Bitcoin Cash (BCH/USD) Price Prediction via Technical Analysis for 20 August 2018
Binance Coin (BNB/USD) Price Prediction via Technical Analysis for 20 August 2018

