


Binance Coin (BNB) Price Predictions / Binance Coin (BNB) Forecast
| After | Price | Change |
|---|---|---|
| 1 day | $9.9577 | 0.52% |
| 1 week | $9.9139 | 0.08% |
| 1 month | $10.1967 | 2.94% |
| 6 months | $11.2889 | 13.96% |
| 1 year | $15.5784 | 57.27% |
| 5 years | $37.7322 | 280.91% |
As per recent news, 90% of Binance's Employees Choose to Receive Salary in BNB Tokens. However we've applied Technical Analysis to the price of Binance Coin (BNB/USD) for today and predict where price is headed.
Relative Strength Index (RSI) is an important indicator that measures speed and change of price movements. Its value ranges between zero and 100. Value around 30 and below is considered oversold region and around 70 and above considered overbought regions. Relative Strength Index is showing Neutral signal, with value at 36.60363.
The Commodity Channel Index (CCI) is a momentum oscillator used in technical analysis to measure an instrument's deviation from its statistical average. Commodity Channel Index is indicating Neutral action, with value at -87.14847.
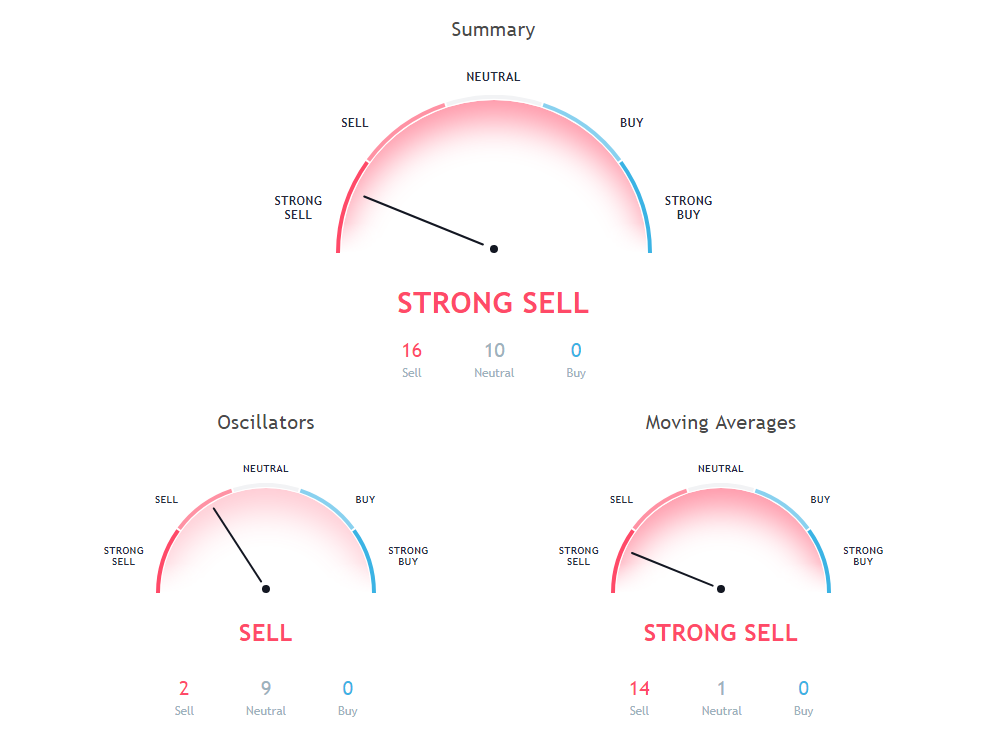
The stochastic oscillator is a momentum indicator that compares the closing price of a security with the price range over a specific period. Stochastic oscillator is at 29.084652, indicating Neutral action.
200 days Simple Moving Average is indicating Sell since Binance Coin is trading at $9.90575432, below 200 days Simple Moving Average value of 12.414515. 100 days Simple Moving Average is at 13.56822, showing Sell signal. Current price $9.90575432 of Binance Coin is below 100 days Simple Moving Average. 9 days Ichimoku Cloud Base Line is indicating Neutral action with value at 11.713101,Binance Coin is trading below 9 days Ichimoku Cloud Base Line at $9.90575432.
20 days Volume Weighted Moving Average is indicating Sell since Binance Coin is trading at $9.90575432, below 20 days Volume Weighted Moving Average value of 12.291783. 100 days Exponential Moving Average is at 12.832482, showing Sell signal. Current price $9.90575432 of Binance Coin is below 100 days Exponential Moving Average. 10 days Exponential Moving Average is at 10.536733, showing Sell signal. Current price $9.90575432 of Binance Coin is below 10 days Exponential Moving Average.
9 days Hull Moving Average is indicating Sell action with value at 10.117353, Binance Coin is trading below 9 days Hull Moving Average at $9.90575432. 50 days Simple Moving Average is at 12.643658, showing Sell signal. Current price $9.90575432 of Binance Coin is below 50 days Simple Moving Average. 30 days Exponential Moving Average is at 11.828422, showing Sell signal. Current price $9.90575432 of Binance Coin is below 30 days Exponential Moving Average.
Also Read: Best Crypto Hardware Wallets
20 days Simple Moving Average is indicating Sell since Binance Coin is trading at $9.90575432, below 20 days Simple Moving Average value of 11.837621. 20 days Exponential Moving Average is indicating Sell since Binance Coin is trading at $9.90575432, below 20 days Exponential Moving Average value of 11.324769. 200 days Exponential Moving Average is at 11.688109, showing Sell signal. Current price $9.90575432 of Binance Coin is below 200 days Exponential Moving Average.
10 days Simple Moving Average is indicating Sell action with value at 10.338843, Binance Coin is trading below 10 days Simple Moving Average at $9.90575432. 30 days Simple Moving Average is indicating Sell action with value at 12.302441, Binance Coin is trading below 30 days Simple Moving Average at $9.90575432. 50 days Exponential Moving Average is at 12.429636, showing Sell signal. Current price $9.90575432 of Binance Coin is below 50 days Exponential Moving Average.
Other Technical Price Analysis for today:
Bitcoin (BTC/USD) Price Prediction via Technical Analysis for 20 August 2018
Bitcoin Cash (BCH/USD) Price Prediction via Technical Analysis for 20 August 2018
Stellar (XLM/USD) Price Prediction via Technical Analysis for 20 August 2018

