


Bitcoin (BTC) Price Predictions / Bitcoin (BTC) Forecast
| After | Price | Change |
|---|---|---|
| 1 day | $6,474.1678 | 0.11% |
| 1 week | $6,525.1985 | 0.89% |
| 1 month | $6,503.9640 | 0.57% |
| 6 months | $7,208.2633 | 11.46% |
| 1 year | $9,642.8705 | 49.10% |
| 5 years | $23,673.9306 | 266.05% |
A popular Bitcoin mining hardware device firm - Bitmain, is gearing up for an IPO, but there are many roadblocks that it has to overcome. Howeverm we've applied Technical Analysis to the price of Bitcoin (BTC/USD) for today and predict where price is headed.
The Stochastic Oscillator is a range bound momentum oscillator. Stochastic oscillator is at 45.2, indicating Neutral action.
The Relative Strength Index (RSI) is an important indicator for measuring the speed and variation of price movements. Its value ranges from zero and 100. The value around 30 and below is considered an oversold region and over 70 as oversold regions. Relative Strength Index is at 43.2, indicating Neutral action.
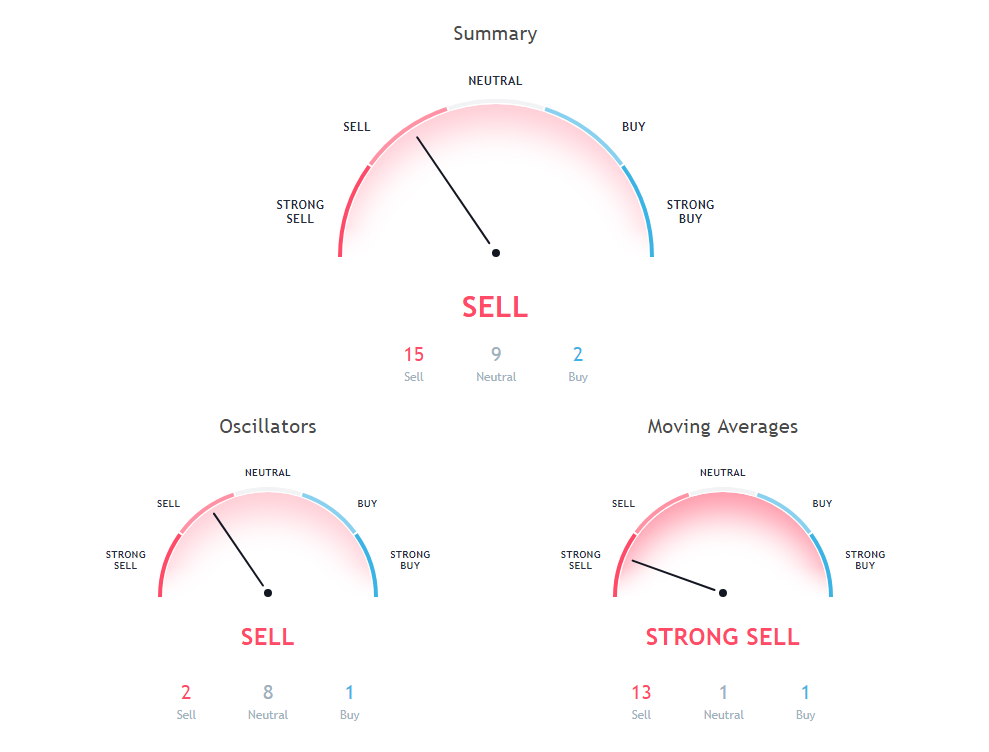
The Commodity Channel Index (CCI) is a momentum-based technical trading tool used to determine when a market is overbought or oversold. Commodity Channel Index is at -31.9, indicating Neutral action.
200 days Exponential Moving Average is at 7652.1, showing Sell signal. Current price $6467.33 of Bitcoin is below 200 days Exponential Moving Average. 20 days Simple Moving Average is at 6635.4, showing Sell signal. Current price $6467.33 of Bitcoin is below 20 days Simple Moving Average. 50 days Exponential Moving Average is indicating Sell action with value at 6885.3, Bitcoin is trading below 50 days Exponential Moving Average at $6467.33.
100 days Exponential Moving Average is at 7222.6, showing Sell signal. Current price $6467.33 of Bitcoin is below 100 days Exponential Moving Average. 10 days Exponential Moving Average is indicating Sell since Bitcoin is trading at $6467.33, below 10 days Exponential Moving Average value of 6456.4. 20 days Exponential Moving Average is indicating Sell action with value at 6635.5, Bitcoin is trading below 20 days Exponential Moving Average at $6467.33.
100 days Simple Moving Average is indicating Sell since Bitcoin is trading at $6467.33, below 100 days Simple Moving Average value of 7068.3. 200 days Simple Moving Average is indicating Sell since Bitcoin is trading at $6467.33, below 200 days Simple Moving Average value of 7953.9. 9 days Hull Moving Average is indicating Sell action with value at 6522.8, Bitcoin is trading below 9 days Hull Moving Average at $6467.33.
Also Read: Best Cryptocurrency To Invest in 2018 with Detailed Analysis
30 days Exponential Moving Average is indicating Sell since Bitcoin is trading at $6467.33, below 30 days Exponential Moving Average value of 6753.6. 50 days Simple Moving Average is indicating Sell since Bitcoin is trading at $6467.33, below 50 days Simple Moving Average value of 6945.2. 10 days Simple Moving Average is indicating Buy action with value at 6348.7, Bitcoin is trading below 10 days Simple Moving Average at $6467.33.
30 days Simple Moving Average is at 7096.3, showing Sell signal. Current price $6467.33 of Bitcoin is below 30 days Simple Moving Average. 20 days Volume Weighted Moving Average is indicating Sell since Bitcoin is trading at $6467.33, below 20 days Volume Weighted Moving Average value of 6561. 9 days Ichimoku Cloud Base Line is indicating Neutral action with value at 7090.9, Bitcoin is trading below 9 days Ichimoku Cloud Base Line at $6467.33.
Other Technical Price Analysis for today:
Stellar (XLM/USD) Price Prediction via Technical Analysis for 20 August 2018
Bitcoin Cash (BCH/USD) Price Prediction via Technical Analysis for 20 August 2018
Binance Coin (BNB/USD) Price Prediction via Technical Analysis for 20 August 2018

