


Ethereum Classic (ETC) Price Predictions / Ethereum Classic (ETC) Forecast
| After | Price | Change |
|---|---|---|
| 1 day | $8.9703 | 0.00% |
| 1 week | $9.0169 | 0.52% |
| 1 month | $9.1467 | 1.97% |
| 6 months | $10.9920 | 22.54% |
| 1 year | $16.8982 | 88.39% |
| 5 years | $57.0366 | 535.86% |
The Stochastic Oscillator is a range bound momentum oscillator. Stochastic oscillator is showing Neutral signal, with value at 8.14.
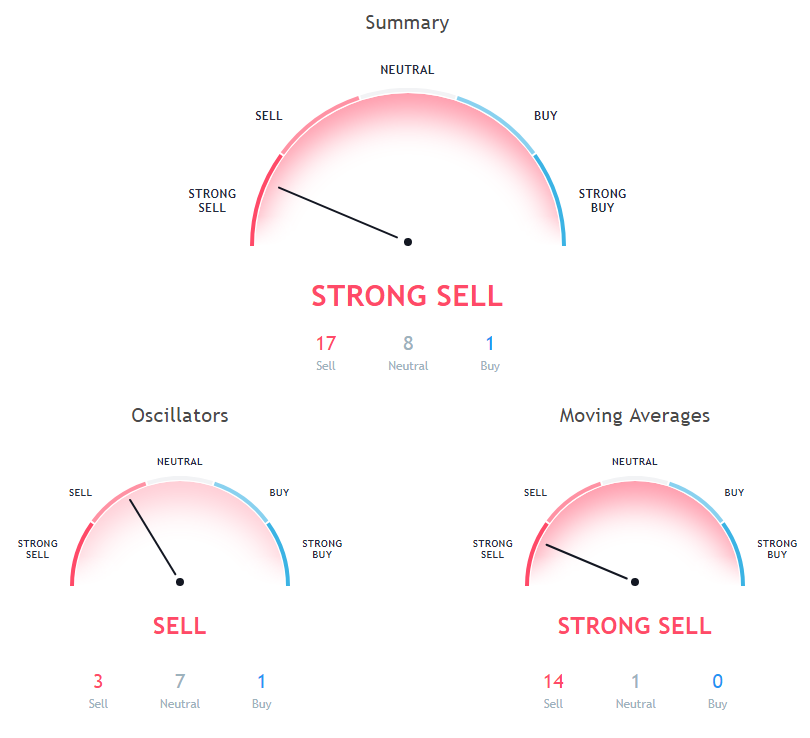
The Commodity Channel Index (CCI) is a momentum-based technical trading tool used to determine when a market is overbought or oversold. Commodity Channel Index is indicating Neutral action, with value at -195.73.
The Relative Strength Index (RSI) is an important indicator for measuring the speed and variation of price movements. Its value ranges from zero and 100. The value around 30 and below is considered an oversold region and over 70 as oversold regions. Relative Strength Index is indicating Neutral action, with value at 30.44.
50 days Exponential Moving Average is at 10.67, showing Sell signal, Ethereum Classic is trading below it at $8.97. 30 days Exponential Moving Average is indicating Sell action with value at 10.11, Ethereum Classic is trading below it at $8.97. 10 days Exponential Moving Average is at 9.56, showing Sell signal, Ethereum Classic is trading below it at $8.97.
9 days Ichimoku Cloud Base Line is indicating Neutral since Ethereum Classic is trading at $8.97, below MAs value of 10.12. 20 days Exponential Moving Average is indicating Sell since Ethereum Classic is trading at $8.97, below MAs value of 9.84. 100 days Exponential Moving Average is at 12.08, showing Sell signal, Ethereum Classic is trading below it at $8.97.
50 days Simple Moving Average is indicating Sell action with value at 10.54, Ethereum Classic is trading below it at $8.97. 100 days Simple Moving Average is indicating Sell action with value at 12.32, Ethereum Classic is trading below it at $8.97. 30 days Simple Moving Average is at 10.15, showing Sell signal, Ethereum Classic is trading below it at $8.97.
20 days Simple Moving Average is indicating Sell since Ethereum Classic is trading at $8.97, below MAs value of 9.7. 10 days Simple Moving Average is at 9.67, showing Sell signal, Ethereum Classic is trading below it at $8.97. 9 days Hull Moving Average is indicating Sell since Ethereum Classic is trading at $8.97, below MAs value of 9.18.
Also Read: A Complete Ledger Nano S Review & Step-by-Step Setup Guide
20 days Volume Weighted Moving Average is indicating Sell since Ethereum Classic is trading at $8.97, below MAs value of 9.69. 200 days Simple Moving Average is at 14.78, showing Sell signal, Ethereum Classic is trading below it at $8.97. 200 days Exponential Moving Average is at 14.28, showing Sell signal, Ethereum Classic is trading below it at $8.97.
Other Technical Price Analysis for today:
Bitcoin (BTC) Price Moved Into A Bearish Zone Below $6,350 - Bitcoin Price Analysis - 30 Oct 2018
Ripple (XRP/USD) Found A Strong Buying Interest Near $0.4340 - Ripple Price Analysis - 30 Oct 2018

