


Bitcoin (BTC) Price Predictions / Bitcoin (BTC) Forecast
| After | Price | Change |
|---|---|---|
| 1 day | $6,367.5272 | 0.77% |
| 1 week | $6,348.7000 | 0.47% |
| 1 month | $6,323.9649 | 0.08% |
| 6 months | $6,805.1732 | 7.69% |
| 1 year | $9,176.0047 | 45.21% |
| 5 years | $23,949.5278 | 279.01% |
The Commodity Channel Index (CCI) is a momentum-based technical trading tool used to determine when a market is overbought or oversold. Commodity Channel Index is showing Neutral signal, with value at -88.9.
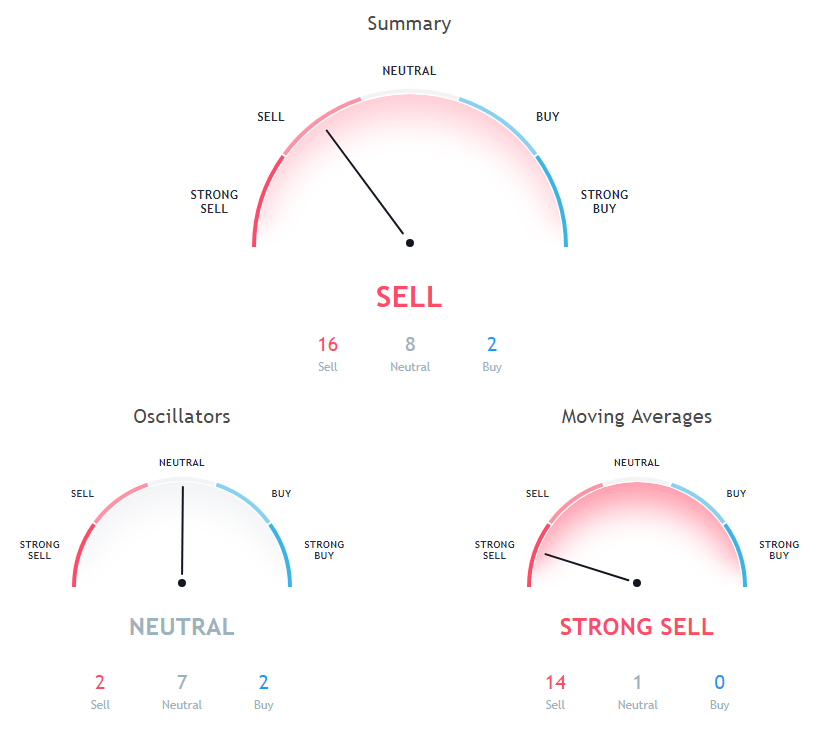
The stochastic oscillator is a momentum indicator that compares the closing price of a security with the price range over a specific period. Stochastic oscillator is indicating Neutral action, with value at 8.1.
The Relative Strength Index (RSI) is an important indicator for measuring the speed and variation of price movements. Its value ranges from zero and 100. The value around 30 and below is considered an oversold region and over 70 as oversold regions. Relative Strength Index is showing Neutral signal, with value at 38.7.
9 days Ichimoku Cloud Base Line is indicating Neutral action with value at 7004.2, Bitcoin is trading below it at $6318.98. 30 days Simple Moving Average is indicating Sell action with value at 6540.1, Bitcoin is trading below it at $6318.98. 50 days Exponential Moving Average is indicating Sell since Bitcoin is trading at $6318.98, below MAs value of 6566.6.
20 days Simple Moving Average is indicating Sell since Bitcoin is trading at $6318.98, below MAs value of 6508.5. 50 days Simple Moving Average is at 6530.2, showing Sell signal, Bitcoin is trading below it at $6318.98. 200 days Exponential Moving Average is at 7107.7, showing Sell signal, Bitcoin is trading below it at $6318.98.
20 days Exponential Moving Average is indicating Sell action with value at 6511.8, Bitcoin is trading below it at $6318.98. 100 days Simple Moving Average is at 6738.2, showing Sell signal, Bitcoin is trading below it at $6318.98. 9 days Hull Moving Average is at 6375.7, showing Sell signal, Bitcoin is trading below it at $6318.98.
10 days Exponential Moving Average is indicating Sell action with value at 6474.2, Bitcoin is trading below it at $6318.98. 100 days Exponential Moving Average is indicating Sell since Bitcoin is trading at $6318.98, below MAs value of 6726.1. 200 days Simple Moving Average is indicating Sell since Bitcoin is trading at $6318.98, below MAs value of 7175.9.
Also Read: Best Ways to Buy Bitcoin with Western Union in 2018
10 days Simple Moving Average is indicating Sell action with value at 6501.1, Bitcoin is trading below it at $6318.98. 20 days Volume Weighted Moving Average is at 6541.7, showing Sell signal, Bitcoin is trading below it at $6318.98. 30 days Exponential Moving Average is indicating Sell action with value at 6530.1, Bitcoin is trading below it at $6318.98.
Other Technical Price Analysis for today:
Ripple (XRP/USD) Found A Strong Buying Interest Near $0.4340 - Ripple Price Analysis - 30 Oct 2018

