


In the previous post, we applied Technical Analysis to Cardano. Today, we're going to apply Technical Analysis to Ethereum, we'll see how ETH is at a crucial long-term support level and explore a long trade.
Ethereum at crucial support level of 400-405
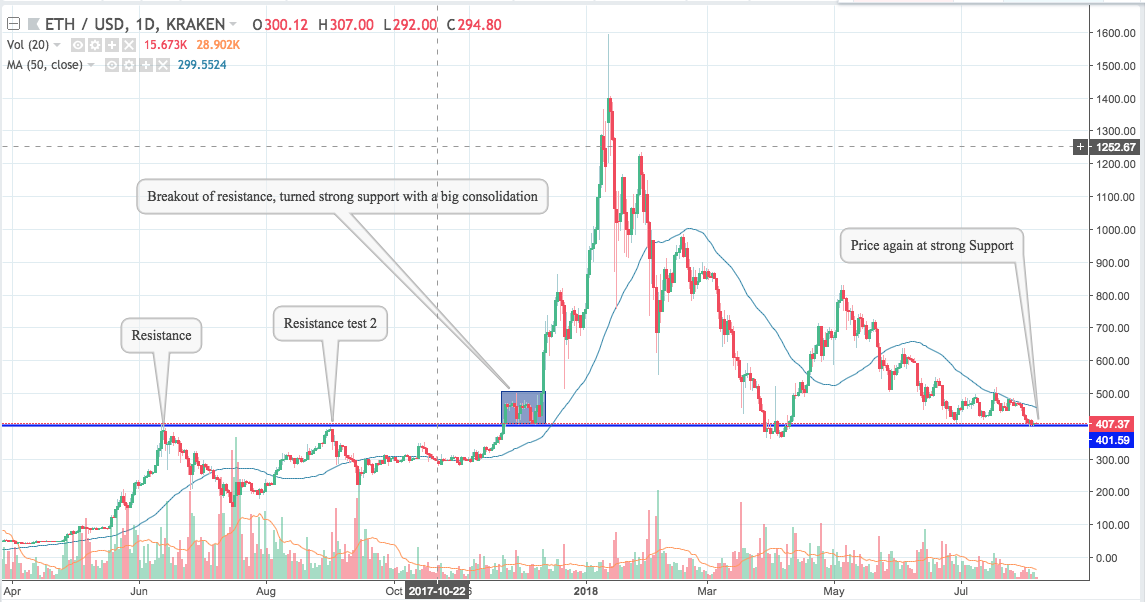
Supports and resistance are always a range and not a line. As we can see in the below Chart-1, Ethereum level of 400 was first time tested in mid-June 2017 but failed to go above it, which made it a resistance. ETH again tested the level of 400 at the end of August 2017, which made 400 level a very strong resistance. Ethereum then surpassed this level in late November last year and sustained above it, it later formed a strong basis at those level with consolidating till Mid-December and turning this point into a major support level. Ethereum right now is trading at this crucial level of support.
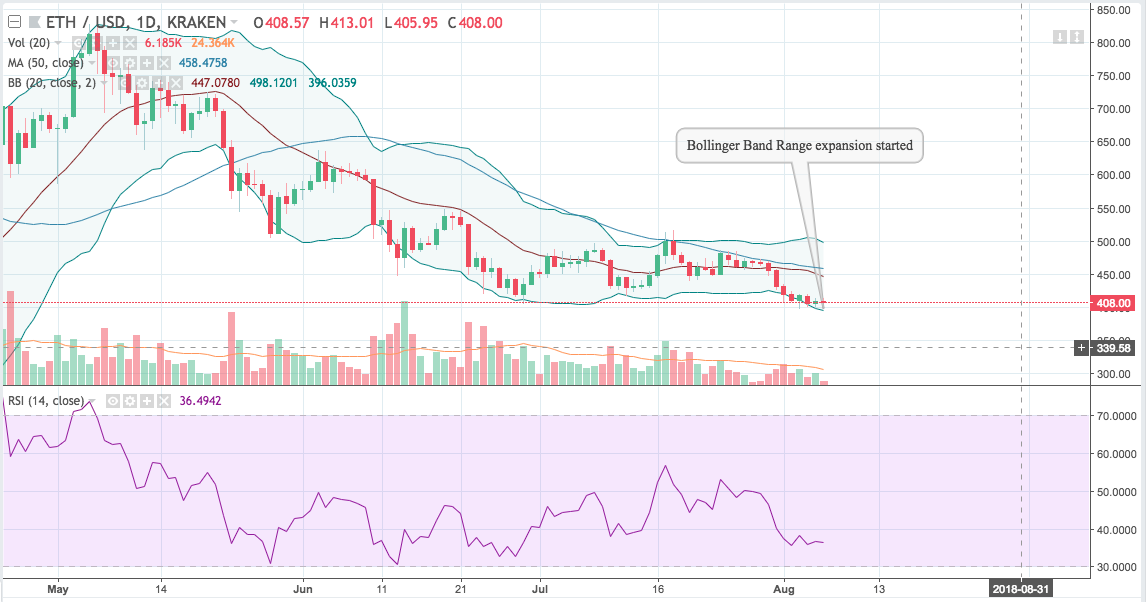
Bollinger Band Range expansion started, which means volatility can increase
Bollinger Band is a Technical Indicator which is created by applying two standard deviations away from Simple Moving Average (SMA). We've applied Bollinger Band with 20 days SMA. Bollinger Band is showing that below band is starting to expand, which means volatility is going to raise for the price. Bollinger bands are in narrow range right now, so there is high probability that a range expansion is beginning. Price is trading at the below band, which shows oversold level. RSI confirms the same oversold levels.
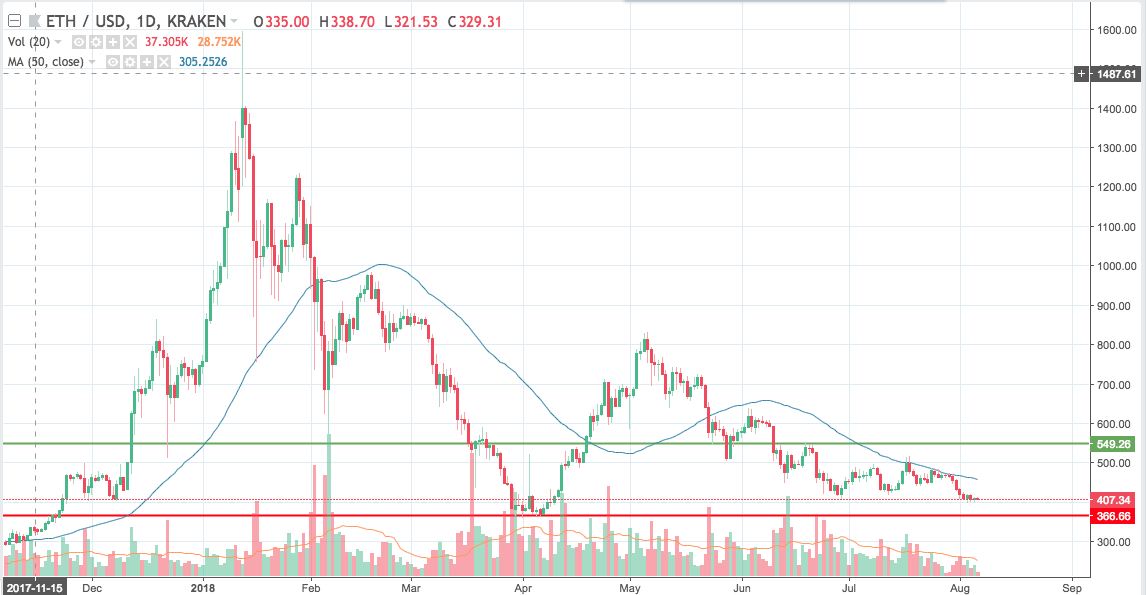
Ethereum at major support with oversold levels means a good Long trade
As we saw, Ethereum is at a crucial support level and is oversold. These conditions show a good risk-reward trade on long side. Trader can consider going long at current level with Target near 550 and StopLoss near 366. 366 level is derived from the bear trap that Ethereum had in April this year. Risk-reward for this trade is ~1:4.
Disclaimer: Views expressed here are those of the author and aren’t an investment or trading advice. Trading involves risk and so do your due diligence before making a trading decision.

