


Bitcoin Cash (BCH) Price Predictions / Bitcoin Cash (BCH) Forecast
| After | Price | Change |
|---|---|---|
| 1 day | $438.7411 | 0.27% |
| 1 week | $438.2000 | 0.15% |
| 1 month | $445.0197 | 1.70% |
| 6 months | $627.2506 | 43.35% |
| 1 year | $1,033.8079 | 136.27% |
| 5 years | $3,399.3489 | 676.89% |
Relative Strength Index (RSI) is an important indicator that measures speed and change of price movements. Its value ranges between zero and 100. Value around 30 and below is considered oversold region and around 70 and above considered overbought regions. Relative Strength Index is indicating Neutral action, with value at 39.6.
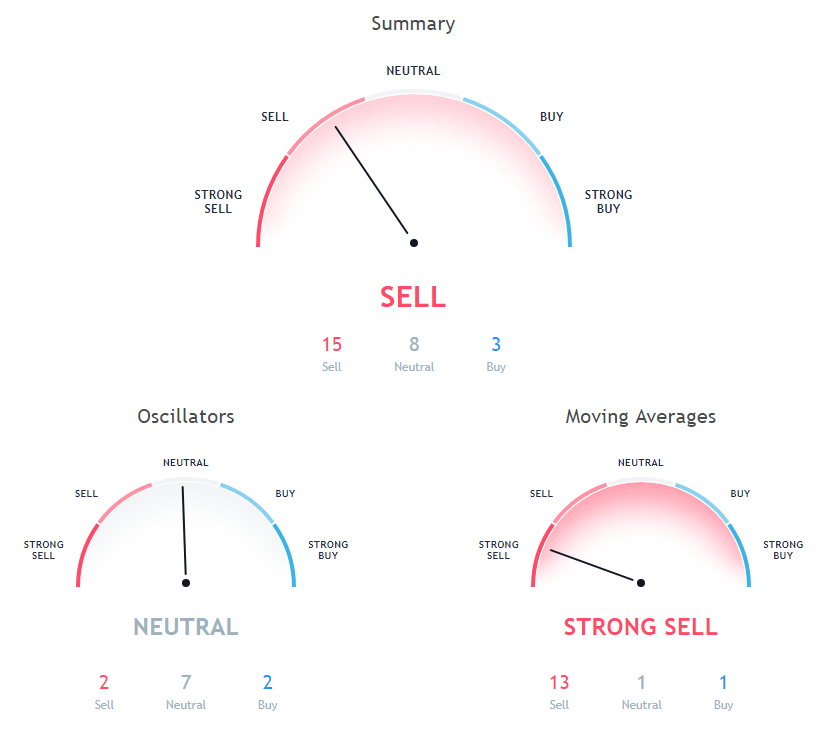
The stochastic oscillator is a momentum indicator that compares the closing price of a security with the price range over a specific period. Stochastic oscillator is indicating Neutral action, with value at 6.8.
The Commodity Channel Index (CCI) is a momentum oscillator used in technical analysis to measure an instrument's deviation from its statistical average. Commodity Channel Index is showing Neutral signal, with value at -75.9.
10 days Exponential Moving Average is indicating Sell since Bitcoin Cash is trading at $437.56, below MAs value of 447.2. 200 days Exponential Moving Average is indicating Sell since Bitcoin Cash is trading at $437.56, below MAs value of 701. 20 days Simple Moving Average is indicating Sell since Bitcoin Cash is trading at $437.56, below MAs value of 453.1.
20 days Exponential Moving Average is indicating Sell since Bitcoin Cash is trading at $437.56, below MAs value of 457.7. 30 days Simple Moving Average is at 476.6, showing Sell signal, Bitcoin Cash is trading below it at $437.56. 100 days Simple Moving Average is at 550, showing Sell signal, Bitcoin Cash is trading below it at $437.56.
50 days Simple Moving Average is indicating Sell since Bitcoin Cash is trading at $437.56, below MAs value of 474.6. 20 days Volume Weighted Moving Average is indicating Sell since Bitcoin Cash is trading at $437.56, below MAs value of 454.7. 9 days Hull Moving Average is indicating Buy since Bitcoin Cash is trading at $437.56, below MAs value of 438.6.
9 days Ichimoku Cloud Base Line is at 482, showing Neutral signal, Bitcoin Cash is trading below it at $437.56. 200 days Simple Moving Average is at 791.8, showing Sell signal, Bitcoin Cash is trading below it at $437.56. 30 days Exponential Moving Average is indicating Sell since Bitcoin Cash is trading at $437.56, below MAs value of 467.2.
Also Read: How to Buy and Sell Cryptocurrency?
50 days Exponential Moving Average is at 488.8, showing Sell signal, Bitcoin Cash is trading below it at $437.56. 100 days Exponential Moving Average is indicating Sell since Bitcoin Cash is trading at $437.56, below MAs value of 566.8. 10 days Simple Moving Average is at 447.6, showing Sell signal, Bitcoin Cash is trading below it at $437.56.
Other Technical Price Analysis for today:
Bitcoin (BTC) Price Is Strugges To Move Above $6,420 - Bitcoin Price Analysis - 29 Oct 2018
Ethereum (ETH) Price Improves Gradually - Ethereum Price Analysis - 29 Oct 2018

