


Bitcoin (BTC) Price Predictions / Bitcoin (BTC) Forecast
| After | Price | Change |
|---|---|---|
| 1 day | $6,482.5357 | 0.36% |
| 1 week | $6,574.4921 | 1.79% |
| 1 month | $6,485.7812 | 0.41% |
| 6 months | $6,981.5359 | 8.09% |
| 1 year | $9,336.1926 | 44.54% |
| 5 years | $24,107.7962 | 273.23% |
The Stochastic Oscillator is a range bound momentum oscillator. Stochastic oscillator is showing Neutral signal, with value at 11.9.
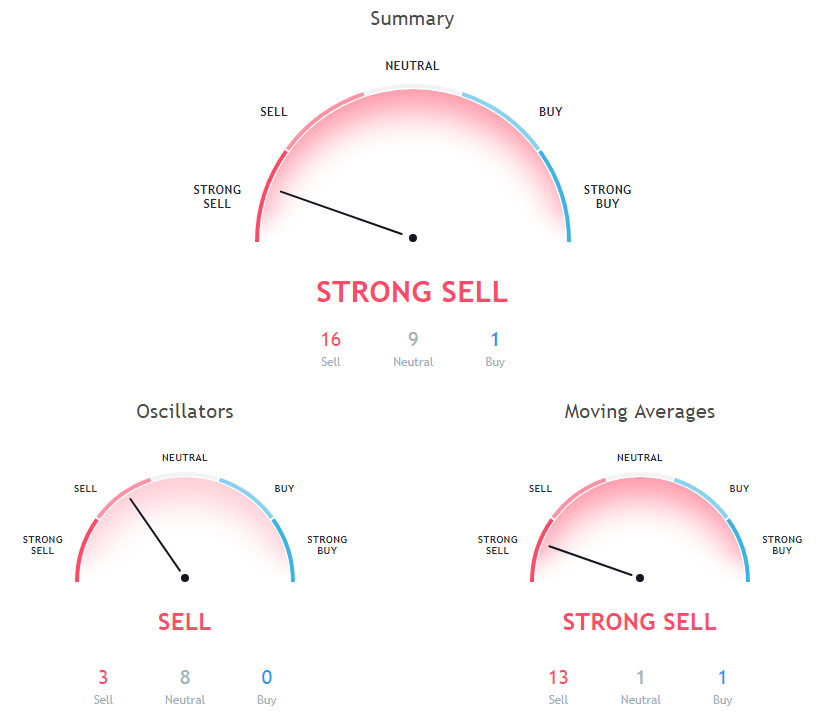
The Commodity Channel Index (CCI) is a momentum oscillator used in technical analysis to measure an instrument's deviation from its statistical average. Commodity Channel Index is indicating Neutral action, with value at -25.
The Relative Strength Index (RSI) is an important indicator for measuring the speed and variation of price movements. Its value ranges from zero and 100. The value around 30 and below is considered an oversold region and over 70 as oversold regions. Relative Strength Index is at 45.8, indicating Neutral action.
20 days Exponential Moving Average is indicating Sell action with value at 6542.4, Bitcoin is trading below it at $6459.17. 200 days Exponential Moving Average is indicating Sell action with value at 7116.7, Bitcoin is trading below it at $6459.17. 9 days Ichimoku Cloud Base Line is indicating Neutral action with value at 7004.2, Bitcoin is trading below it at $6459.17.
100 days Simple Moving Average is indicating Sell action with value at 6750.1, Bitcoin is trading below it at $6459.17. 50 days Exponential Moving Average is indicating Sell since Bitcoin is trading at $6459.17, below MAs value of 6581.1. 10 days Exponential Moving Average is at 6527.6, showing Sell signal, Bitcoin is trading below it at $6459.17.
30 days Simple Moving Average is at 6553.9, showing Sell signal, Bitcoin is trading below it at $6459.17. 20 days Volume Weighted Moving Average is indicating Sell since Bitcoin is trading at $6459.17, below MAs value of 6561.3. 100 days Exponential Moving Average is at 6736.6, showing Sell signal, Bitcoin is trading below it at $6459.17.
50 days Simple Moving Average is indicating Sell action with value at 6532.4, Bitcoin is trading below it at $6459.17. 9 days Hull Moving Average is indicating Buy since Bitcoin is trading at $6459.17, below MAs value of 6482.8. 20 days Simple Moving Average is indicating Sell since Bitcoin is trading at $6459.17, below MAs value of 6529.6.
Also Read: Best Bitcoin Debit Cards of 2018
200 days Simple Moving Average is at 7184.3, showing Sell signal, Bitcoin is trading below it at $6459.17. 10 days Simple Moving Average is at 6538.5, showing Sell signal, Bitcoin is trading below it at $6459.17. 30 days Exponential Moving Average is at 6551.7, showing Sell signal, Bitcoin is trading below it at $6459.17.
Other Technical Price Analysis for today:
Bitcoin Cash (BCH) May Recover If Buyers Gain Momentum - Bitcoin Cash Price Analysis - 29 Oct 2018
Ethereum (ETH) Price Improves Gradually - Ethereum Price Analysis - 29 Oct 2018

