


Ethereum (ETH) Price Predictions / Ethereum (ETH) Forecast
| After | Price | Change |
|---|---|---|
| 1 day | $204.4419 | 0.51% |
| 1 week | $207.1583 | 1.85% |
| 1 month | $205.1068 | 0.84% |
| 6 months | $307.3080 | 51.09% |
| 1 year | $467.7283 | 129.95% |
| 5 years | $1,600.8889 | 687.06% |
The Commodity Channel Index (CCI) is a momentum-based technical trading tool used to determine when a market is overbought or oversold. Commodity Channel Index is indicating Neutral action, with value at -15.72.
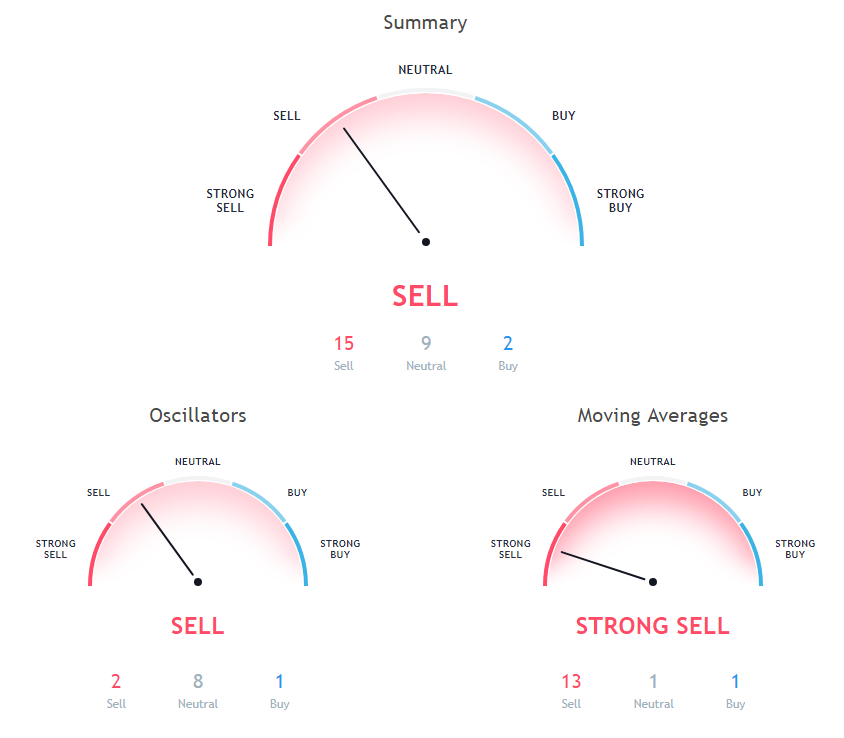
The Relative Strength Index (RSI) is an important indicator for measuring the speed and variation of price movements. Its value ranges from zero and 100. The value around 30 and below is considered an oversold region and over 70 as oversold regions. Relative Strength Index is indicating Neutral action, with value at 43.45.
The Stochastic Oscillator is a range bound momentum oscillator. Stochastic oscillator is showing Neutral signal, with value at 19.08.
100 days Simple Moving Average is indicating Sell action with value at 275.3, Ethereum is trading below it at $203.4. 9 days Hull Moving Average is indicating Buy since Ethereum is trading at $203.4, below MAs value of 204.38. 100 days Exponential Moving Average is indicating Sell since Ethereum is trading at $203.4, below MAs value of 281.75.
50 days Simple Moving Average is indicating Sell since Ethereum is trading at $203.4, below MAs value of 214.76. 9 days Ichimoku Cloud Base Line is indicating Neutral action with value at 215.49, Ethereum is trading below it at $203.4. 200 days Simple Moving Average is indicating Sell since Ethereum is trading at $203.4, below MAs value of 422.88.
20 days Exponential Moving Average is indicating Sell action with value at 208.7, Ethereum is trading below it at $203.4. 10 days Exponential Moving Average is indicating Sell action with value at 205.76, Ethereum is trading below it at $203.4. 30 days Simple Moving Average is at 213.15, showing Sell signal, Ethereum is trading below it at $203.4.
20 days Volume Weighted Moving Average is at 205.55, showing Sell signal, Ethereum is trading below it at $203.4. 20 days Simple Moving Average is indicating Sell action with value at 206.11, Ethereum is trading below it at $203.4. 50 days Exponential Moving Average is indicating Sell since Ethereum is trading at $203.4, below MAs value of 227.31.
Also Read: Best Penny Cryptocurrency To Invest In 2018
30 days Exponential Moving Average is indicating Sell action with value at 212.95, Ethereum is trading below it at $203.4. 10 days Simple Moving Average is indicating Sell since Ethereum is trading at $203.4, below MAs value of 205.6. 200 days Exponential Moving Average is indicating Sell since Ethereum is trading at $203.4, below MAs value of 370.99.
Other Technical Price Analysis for today:
Bitcoin Cash (BCH) May Recover If Buyers Gain Momentum - Bitcoin Cash Price Analysis - 29 Oct 2018
Ethereum (ETH) Price Improves Gradually - Ethereum Price Analysis - 29 Oct 2018

