


Bitcoin Cash (BCH) Price Predictions / Bitcoin Cash (BCH) Forecast
| After | Price | Change |
|---|---|---|
| 1 day | $531.2339 | 0.06% |
| 1 week | $533.4064 | 0.47% |
| 1 month | $531.3007 | 0.08% |
| 6 months | $690.7494 | 30.11% |
| 1 year | $1,123.2465 | 111.57% |
| 5 years | $3,546.2792 | 567.97% |
We've applied Technical Analysis to the price of Bitcoin Cash (BCH/USD) for today and predict where price is headed.
The Stochastic Oscillator is a range bound momentum oscillator. Stochastic oscillator is showing Neutral signal, with value at 38.9.
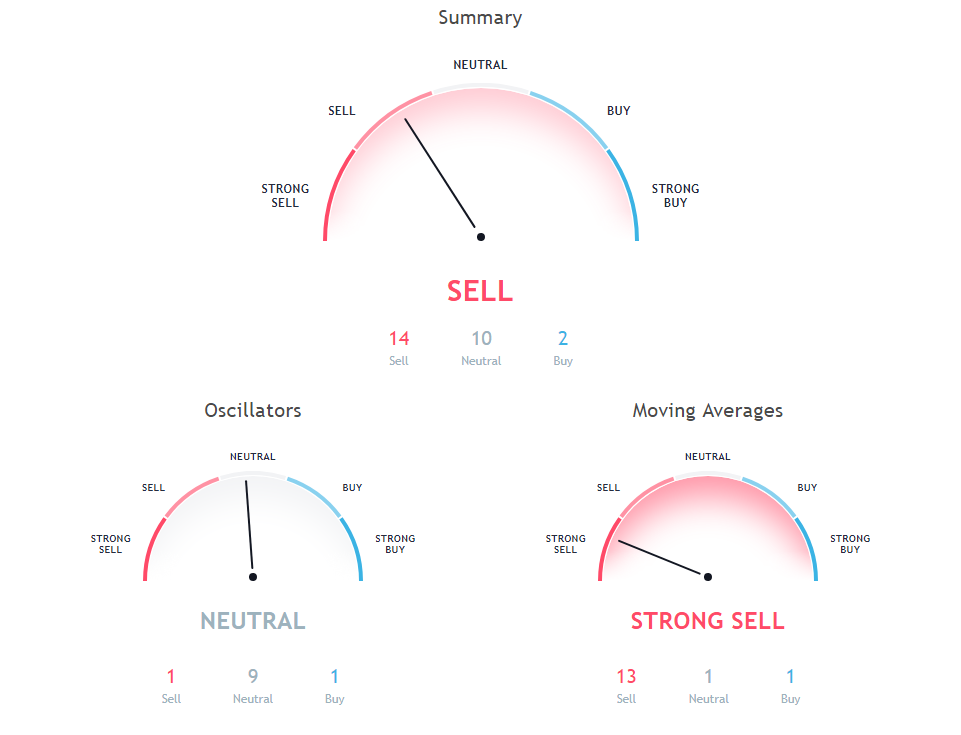
The Commodity Channel Index (CCI) is a momentum-based technical trading tool used to determine when a market is overbought or oversold. Commodity Channel Index is indicating Neutral action, with value at -56.9.
Relative Strength Index (RSI) is an important indicator that measures speed and change of price movements. Its value ranges between zero and 100. Value around 30 and below is considered oversold region and around 70 and above considered overbought regions. Relative Strength Index is indicating Neutral action, with value at 39.
100 days Exponential Moving Average is indicating Sell since Bitcoin Cash is trading at $530.9, below MAs value of 796.3. 30 days Exponential Moving Average is at 615.1, showing Sell signal, Bitcoin Cash is trading below it at $530.9. 20 days Volume Weighted Moving Average is indicating Sell action with value at 561.2, Bitcoin Cash is trading below it at $530.9.
9 days Hull Moving Average is at 518.8, showing Buy signal, Bitcoin Cash is trading below it at $530.9. 20 days Exponential Moving Average is indicating Sell since Bitcoin Cash is trading at $530.9, below MAs value of 579.7. 100 days Simple Moving Average is indicating Sell action with value at 815.1, Bitcoin Cash is trading below it at $530.9.
30 days Simple Moving Average is indicating Sell since Bitcoin Cash is trading at $530.9, below MAs value of 639.1. 9 days Ichimoku Cloud Base Line is indicating Neutral action with value at 653.2, Bitcoin Cash is trading below it at $530.9. 10 days Simple Moving Average is indicating Sell since Bitcoin Cash is trading at $530.9, below MAs value of 538.5.
200 days Simple Moving Average is indicating Sell action with value at 972.6, Bitcoin Cash is trading below it at $530.9. 10 days Exponential Moving Average is indicating Sell action with value at 543, Bitcoin Cash is trading below it at $530.9. 200 days Exponential Moving Average is indicating Sell action with value at 899.9, Bitcoin Cash is trading below it at $530.9.
Also Read: Utlimate Binance Trading Guide
20 days Simple Moving Average is indicating Sell action with value at 569.2, Bitcoin Cash is trading below it at $530.9. 50 days Exponential Moving Average is indicating Sell action with value at 675.4, Bitcoin Cash is trading below it at $530.9. 50 days Simple Moving Average is at 689.5, showing Sell signal, Bitcoin Cash is trading below it at $530.9.
Other Technical Price Analysis for today:
Bitcoin (BTC/USD) Price Prediction via Technical Analysis for 24 August 2018
EOS (EOS/USD) Price Prediction via Technical Analysis for 24 August 2018
Stellar (XLM/USD) Price Prediction via Technical Analysis for 24 August 2018

