


Bitcoin (BTC) Price Predictions / Bitcoin (BTC) Forecast
| After | Price | Change |
|---|---|---|
| 1 day | $6,575.9380 | 0.48% |
| 1 week | $6,643.5938 | 1.51% |
| 1 month | $6,482.2673 | -0.96% |
| 6 months | $7,172.5799 | 9.59% |
| 1 year | $9,602.1384 | 46.71% |
| 5 years | $23,675.6382 | 261.75% |
We've applied Technical Analysis to the price of Bitcoin (BTC/USD) for today and predict where price is headed.
Relative Strength Index (RSI) is an important indicator that measures speed and change of price movements. Its value ranges between zero and 100. Value around 30 and below is considered oversold region and around 70 and above considered overbought regions. Relative Strength Index is indicating Neutral action, with value at 47.
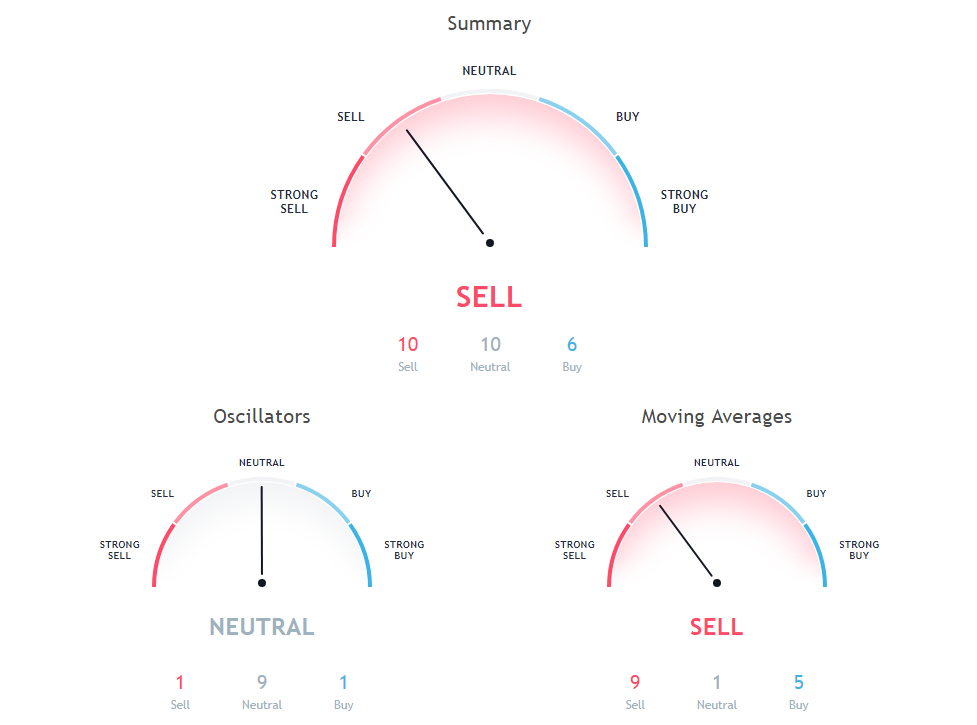
The Commodity Channel Index (CCI) is a momentum-based technical trading tool used to determine when a market is overbought or oversold. Commodity Channel Index is at 31.8, indicating Neutral action.
The Stochastic Oscillator is a range bound momentum oscillator. Stochastic oscillator is at 59.1, indicating Neutral action.
Moving Average (MA) is just average of any subset of numbers. For example, to calculate a basic 10-day moving average you would add up the closing prices from the past 10 days and then divide the result by 10.
20 days Exponential Moving Average is at 6571.4, showing Sell signal, Bitcoin is trading below it at $6544.81. 10 days Simple Moving Average is indicating Buy since Bitcoin is trading at $6544.81, below MAs value of 6420.2. 20 days Volume Weighted Moving Average is indicating Buy since Bitcoin is trading at $6544.81, below MAs value of 6382.9.
50 days Simple Moving Average is indicating Sell since Bitcoin is trading at $6544.81, below MAs value of 6934.3. 50 days Exponential Moving Average is at 6818.3, showing Sell signal, Bitcoin is trading below it at $6544.81. 200 days Simple Moving Average is indicating Sell action with value at 7916.2, Bitcoin is trading below it at $6544.81.
30 days Simple Moving Average is at 6896.9, showing Sell signal, Bitcoin is trading below it at $6544.81. 100 days Exponential Moving Average is indicating Sell action with value at 7161.6, Bitcoin is trading below it at $6544.81. 100 days Simple Moving Average is at 6983.8, showing Sell signal, Bitcoin is trading below it at $6544.81.
Also Read: Best Bitcoin Wallets
200 days Exponential Moving Average is at 7604.1, showing Sell signal, Bitcoin is trading below it at $6544.81. 30 days Exponential Moving Average is at 6679.3, showing Sell signal, Bitcoin is trading below it at $6544.81. 9 days Ichimoku Cloud Base Line is indicating Neutral action with value at 7080.2, Bitcoin is trading below it at $6544.81.
10 days Exponential Moving Average is indicating Buy since Bitcoin is trading at $6544.81, below MAs value of 6455.2. 9 days Hull Moving Average is at 6481.4, showing Buy signal, Bitcoin is trading below it at $6544.81. 20 days Simple Moving Average is indicating Buy action with value at 6441.8, Bitcoin is trading below it at $6544.81.
Other Technical Price Analysis for today:
Bitcoin Cash (BCH/USD) Price Prediction via Technical Analysis for 24 August 2018
EOS (EOS/USD) Price Prediction via Technical Analysis for 24 August 2018
Stellar (XLM/USD) Price Prediction via Technical Analysis for 24 August 2018

