


Bitcoin (BTC) Price Predictions / Bitcoin (BTC) Forecast
| After | Price | Change |
|---|---|---|
| 1 day | $6,984.5126 | 0.40% |
| 1 week | $7,023.5348 | 0.96% |
| 1 month | $7,098.1411 | 2.03% |
| 6 months | $7,742.9967 | 11.30% |
| 1 year | $10,214.1712 | 46.82% |
| 5 years | $24,373.9432 | 250.35% |
We've applied Technical Analysis to the price of Bitcoin (BTC/USD) for today and predict where price is headed.
The Commodity Channel Index (CCI) is a momentum-based technical trading tool used to determine when a market is overbought or oversold. Commodity Channel Index is at 113.5, indicating Sell action.
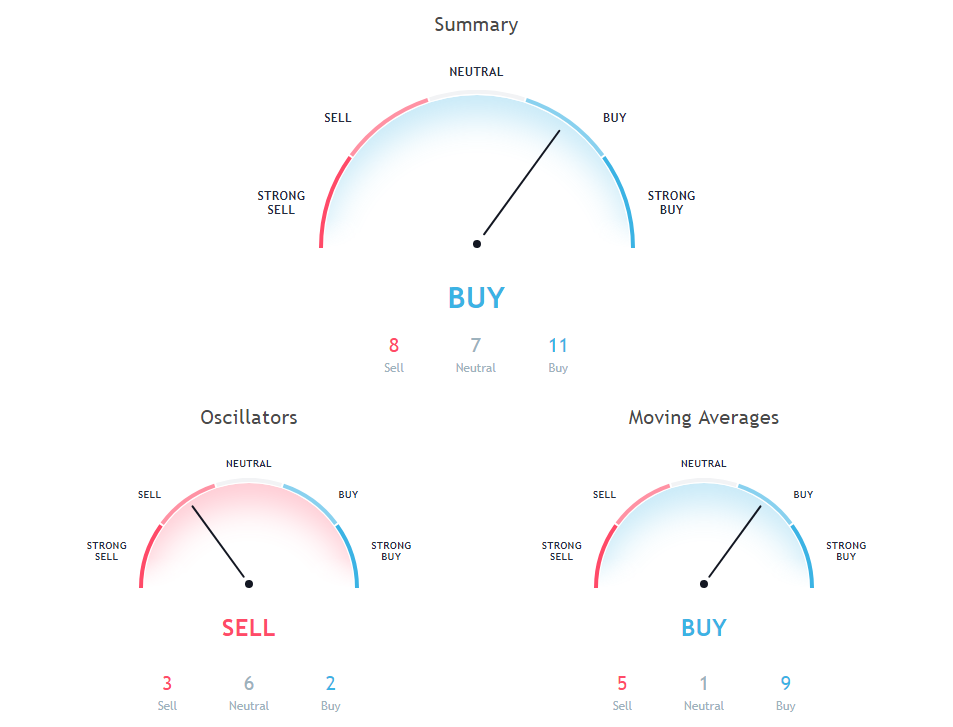
Relative Strength Index (RSI) is an important indicator that measures speed and change of price movements. Its value ranges between zero and 100. Value around 30 and below is considered oversold region and around 70 and above considered overbought regions. Relative Strength Index is indicating Neutral action, with value at 55.1.
The stochastic oscillator is a momentum indicator that compares the closing price of a security with the price range over a specific period. Stochastic oscillator is indicating Sell action, with value at 87.5.
Moving Average (MA) in simple term is just average of any subset of numbers. For example, 50 Days simple moving average is calculated at any point in chart by summing past 50 days of price and then dividing it by 50.
30 days Simple Moving Average is indicating Buy since Bitcoin is trading at $6956.97, below MAs value of 6666.2. 9 days Hull Moving Average is indicating Sell since Bitcoin is trading at $6956.97, below MAs value of 7115.1. 200 days Exponential Moving Average is indicating Sell action with value at 7564.9, Bitcoin is trading below it at $6956.97.
50 days Exponential Moving Average is indicating Buy since Bitcoin is trading at $6956.97, below MAs value of 6842.8. 10 days Exponential Moving Average is at 6800.2, showing Buy signal, Bitcoin is trading below it at $6956.97. 20 days Simple Moving Average is indicating Buy action with value at 6538.3, Bitcoin is trading below it at $6956.97.
200 days Simple Moving Average is indicating Sell action with value at 7880, Bitcoin is trading below it at $6956.97. 20 days Exponential Moving Average is indicating Buy since Bitcoin is trading at $6956.97, below MAs value of 6737.2. 9 days Ichimoku Cloud Base Line is indicating Neutral action with value at 6506.1, Bitcoin is trading below it at $6956.97.
20 days Volume Weighted Moving Average is at 6461.8, showing Buy signal, Bitcoin is trading below it at $6956.97. 50 days Simple Moving Average is at 6977.4, showing Sell signal, Bitcoin is trading below it at $6956.97. 10 days Simple Moving Average is indicating Buy action with value at 6747.6, Bitcoin is trading below it at $6956.97.
Also Read: What is Bitcoin Mining? How to Mine Bitcoin?
100 days Exponential Moving Average is indicating Sell since Bitcoin is trading at $6956.97, below MAs value of 7135.6. 100 days Simple Moving Average is indicating Buy action with value at 6905.3, Bitcoin is trading below it at $6956.97. 30 days Exponential Moving Average is indicating Buy since Bitcoin is trading at $6956.97, below MAs value of 6763.8.
Other Technical Price Analysis for today:
Ethereum (ETH/USD) Price Prediction via Technical Analysis for 30 August 2018
Monero (XMR/USD) Price Prediction via Technical Analysis for 30 August 2018

