


Technical analysis is done by analyzing data gathered from historical trading activity, such as volume, price movement, open, close etc.
Monero (XMR) Price Predictions / Monero (XMR) Forecast
| After | Price | Change |
|---|---|---|
| 1 day | $100.5386 | 0.13% |
| 1 week | $101.2611 | 0.85% |
| 1 month | $104.9410 | 4.51% |
| 6 months | $139.3159 | 38.75% |
| 1 year | $195.5263 | 94.73% |
| 5 years | $580.0328 | 477.66% |
We've applied Technical Analysis to the price of Monero (XMR/USD) for today and predict where price is headed.
The Commodity Channel Index (CCI) is a momentum-based technical trading tool used to determine when a market is overbought or oversold. Commodity Channel Index is at 74.978, indicating Neutral action.
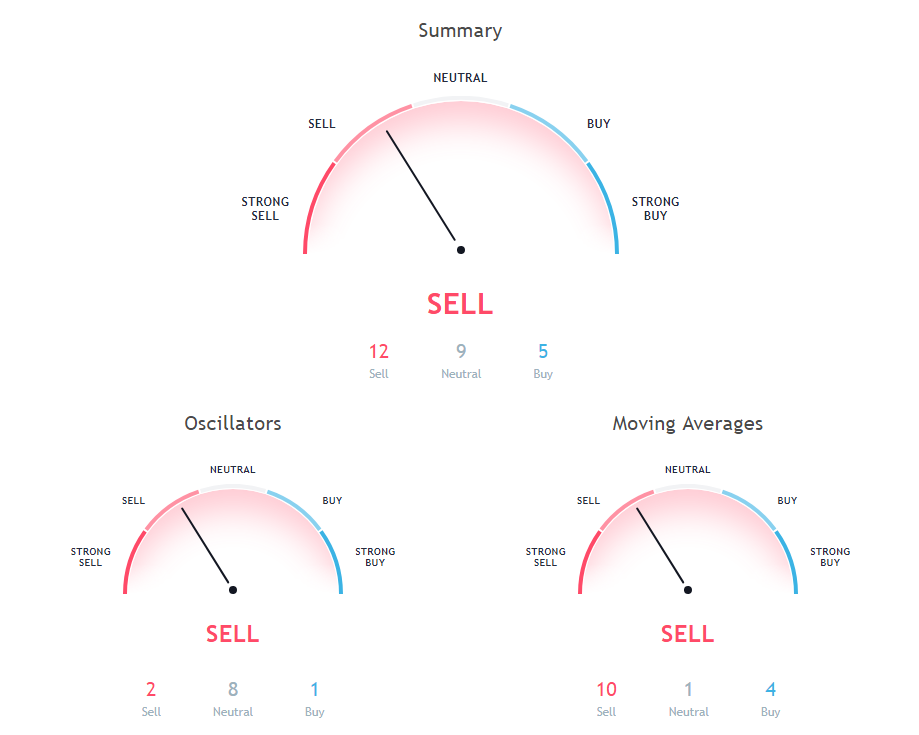
The Relative Strength Index (RSI) is an important indicator for measuring the speed and variation of price movements. Its value ranges from zero and 100. The value around 30 and below is considered an oversold region and over 70 as oversold regions. Relative Strength Index is at 48.376, indicating Neutral action.
The Stochastic Oscillator is a range bound momentum oscillator. Stochastic oscillator is indicating Neutral action, with value at 76.266.
50 days Simple Moving Average is indicating Sell action with value at 113.572, Monero is trading below it at $100.41. 10 days Simple Moving Average is at 97.245, showing Buy signal, Monero is trading below it at $100.41. 200 days Exponential Moving Average is indicating Sell action with value at 157.571, Monero is trading below it at $100.41.
10 days Exponential Moving Average is indicating Buy action with value at 99.279, Monero is trading below it at $100.41. 20 days Volume Weighted Moving Average is indicating Buy action with value at 94.141, Monero is trading below it at $100.41. 100 days Exponential Moving Average is indicating Sell since Monero is trading at $100.41, below MAs value of 131.924.
9 days Hull Moving Average is at 107.352, showing Sell signal, Monero is trading below it at $100.41. 30 days Simple Moving Average is at 100.311, showing Buy signal, Monero is trading below it at $100.41. 20 days Simple Moving Average is at 94.987, showing Buy signal, Monero is trading below it at $100.41.
200 days Simple Moving Average is at 181.729, showing Sell signal, Monero is trading below it at $100.41. 20 days Exponential Moving Average is indicating Buy since Monero is trading at $100.41, below MAs value of 99.931. 100 days Simple Moving Average is indicating Sell action with value at 126.792, Monero is trading below it at $100.41.
Also Read: A to Z of Cryptocurrencies (Dictionary)
30 days Exponential Moving Average is at 103.185, showing Sell signal, Monero is trading below it at $100.41. 50 days Exponential Moving Average is indicating Sell since Monero is trading at $100.41, below MAs value of 110.977. 9 days Ichimoku Cloud Base Line is indicating Neutral action with value at 98.857, Monero is trading below it at $100.41.
Other Technical Price Analysis for today:
Ethereum (ETH/USD) Price Prediction via Technical Analysis for 30 August 2018
Bitcoin (BTC/USD) Price Prediction via Technical Analysis for 30 August 2018

