


Technical analysis is a sub-discipline of trading which is used to evaluate securities with various tools and identify trading opportunities.
Monero (XMR) Price Predictions / Monero (XMR) Forecast
| After | Price | Change |
|---|---|---|
| 1 day | $113.7553 | 0.11% |
| 1 week | $115.2881 | 1.46% |
| 1 month | $115.1446 | 1.33% |
| 6 months | $143.9279 | 26.66% |
| 1 year | $204.8188 | 80.25% |
| 5 years | $586.7229 | 416.35% |
We've applied Technical Analysis to the price of Monero (XMR/USD) for today and predict where price is headed.
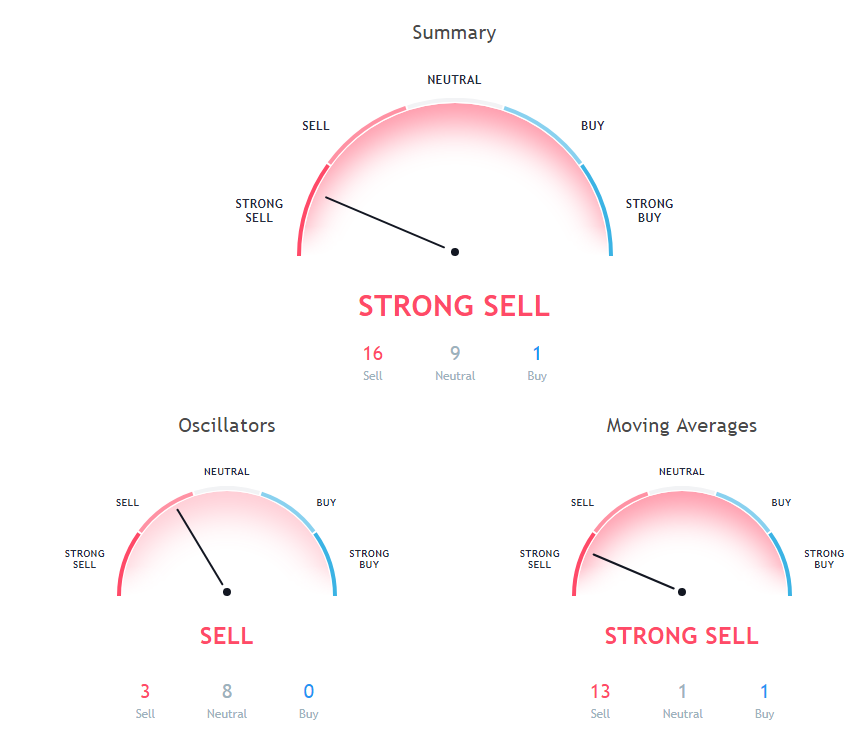
Relative Strength Index (RSI) is an important indicator that measures speed and change of price movements. Its value ranges between zero and 100. Value around 30 and below is considered oversold region and around 70 and above considered overbought regions. Relative Strength Index is indicating Neutral action, with value at 49.091.
The Commodity Channel Index (CCI) is a momentum oscillator used in technical analysis to measure an instrument's deviation from its statistical average. Commodity Channel Index is at -50.339, indicating Neutral action.
The stochastic oscillator is a momentum indicator that compares the closing price of a security with the price range over a specific period. Stochastic oscillator is at 37.584, indicating Neutral action.
50 days Simple Moving Average is indicating Buy since Monero is trading at $113.63, below MAs value of 110.076. 10 days Simple Moving Average is at 115.814, showing Sell signal, Monero is trading below it at $113.63. 9 days Ichimoku Cloud Base Line is at 112.52, showing Neutral signal, Monero is trading below it at $113.63.
200 days Exponential Moving Average is at 145.2, showing Sell signal, Monero is trading below it at $113.63. 9 days Hull Moving Average is indicating Sell action with value at 114.584, Monero is trading below it at $113.63. 20 days Exponential Moving Average is indicating Sell action with value at 115.158, Monero is trading below it at $113.63.
10 days Exponential Moving Average is indicating Sell since Monero is trading at $113.63, below MAs value of 115.509. 200 days Simple Moving Average is at 152.467, showing Sell signal, Monero is trading below it at $113.63. 20 days Simple Moving Average is indicating Sell action with value at 116.106, Monero is trading below it at $113.63.
100 days Simple Moving Average is indicating Sell since Monero is trading at $113.63, below MAs value of 117.021. 100 days Exponential Moving Average is at 123.724, showing Sell signal, Monero is trading below it at $113.63. 30 days Simple Moving Average is at 113.937, showing Sell signal, Monero is trading below it at $113.63.
Also Read: Future of Cryptocurrencies
20 days Volume Weighted Moving Average is indicating Sell since Monero is trading at $113.63, below MAs value of 115.952. 50 days Exponential Moving Average is indicating Sell action with value at 114.454, Monero is trading below it at $113.63. 30 days Exponential Moving Average is indicating Sell since Monero is trading at $113.63, below MAs value of 114.395.
Other Technical Price Analysis for today:
Litecoin (LTC) performs positive in trading, Eyes $60 - Litecoin Price Analysis - 4 Oct 2018
Heavy momentum in NEO trade volume see $20 range again - NEO Price Analysis - 4 Oct 2018

