


NEO (NEO) Price Predictions / NEO (NEO) Forecast
| After | Price | Change |
|---|---|---|
| 1 day | $18.3354 | 0.74% |
| 1 week | $18.5144 | 1.73% |
| 1 month | $18.1024 | -0.54% |
| 6 months | $30.6262 | 68.28% |
| 1 year | $55.0997 | 202.75% |
| 5 years | $196.3307 | 978.74% |
We've applied Technical Analysis to the price of NEO (NEO/USD) for today and predict where price is headed.
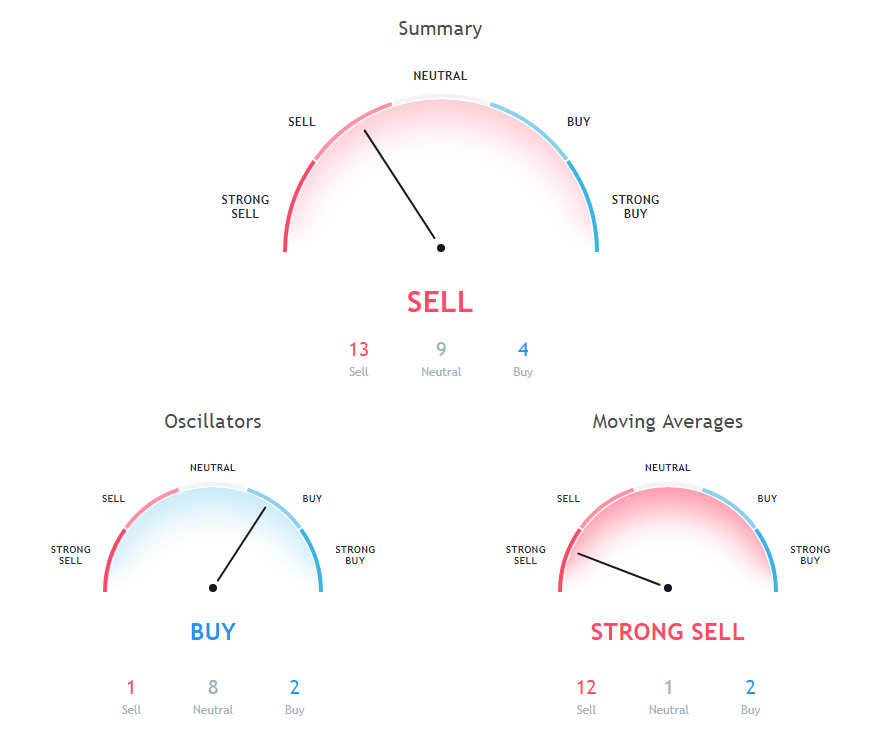
The stochastic oscillator is a momentum indicator that compares the closing price of a security with the price range over a specific period. Stochastic oscillator is at 35.27, indicating Neutral action.
Relative Strength Index (RSI) is an important indicator that measures speed and change of price movements. Its value ranges between zero and 100. Value around 30 and below is considered oversold region and around 70 and above considered overbought regions. Relative Strength Index is showing Neutral signal, with value at 46.33.
The Commodity Channel Index (CCI) is a momentum oscillator used in technical analysis to measure an instrument's deviation from its statistical average. Commodity Channel Index is showing Neutral signal, with value at -16.76.
Moving averages come in many forms, but their use remains the same: to help traders identify the trends of assets by smoothing out the day-to-day price fluctuations.
50 days Simple Moving Average is indicating Sell since NEO is trading at $18.2, below MAs value of 18.88. 30 days Exponential Moving Average is indicating Sell since NEO is trading at $18.2, below MAs value of 18.92. 9 days Hull Moving Average is at 18.14, showing Buy signal, NEO is trading below it at $18.2.
10 days Exponential Moving Average is indicating Sell since NEO is trading at $18.2, below MAs value of 18.52. 200 days Exponential Moving Average is indicating Sell action with value at 36.92, NEO is trading below it at $18.2. 100 days Exponential Moving Average is at 26.76, showing Sell signal, NEO is trading below it at $18.2.
100 days Simple Moving Average is indicating Sell since NEO is trading at $18.2, below MAs value of 24.82. 9 days Ichimoku Cloud Base Line is indicating Neutral action with value at 18.48, NEO is trading below it at $18.2. 200 days Simple Moving Average is indicating Sell action with value at 41.98, NEO is trading below it at $18.2.
10 days Simple Moving Average is indicating Sell since NEO is trading at $18.2, below MAs value of 18.59. 20 days Volume Weighted Moving Average is at 18.48, showing Sell signal, NEO is trading below it at $18.2. 30 days Simple Moving Average is indicating Sell since NEO is trading at $18.2, below MAs value of 18.43.
Also Read: Crytpocurrency Wallets
50 days Exponential Moving Average is at 20.34, showing Sell signal, NEO is trading below it at $18.2. 20 days Exponential Moving Average is indicating Sell since NEO is trading at $18.2, below MAs value of 18.61. 20 days Simple Moving Average is indicating Sell action with value at 18.37, NEO is trading below it at $18.2.
Other Technical Price Analysis for today:
Litecoin (LTC) performs positive in trading, Eyes $60 - Litecoin Price Analysis - 4 Oct 2018

