


Litecoin (LTC) Price Predictions / Litecoin (LTC) Forecast
| After | Price | Change |
|---|---|---|
| 1 day | $52.7920 | 0.58% |
| 1 week | $53.4706 | 1.87% |
| 1 month | $52.5645 | 0.14% |
| 6 months | $71.5055 | 36.23% |
| 1 year | $119.9580 | 128.53% |
| 5 years | $334.4466 | 537.16% |
The Commodity Channel Index (CCI) is a momentum oscillator used in technical analysis to measure an instrument's deviation from its statistical average. Commodity Channel Index is at -56.355, indicating Neutral action.
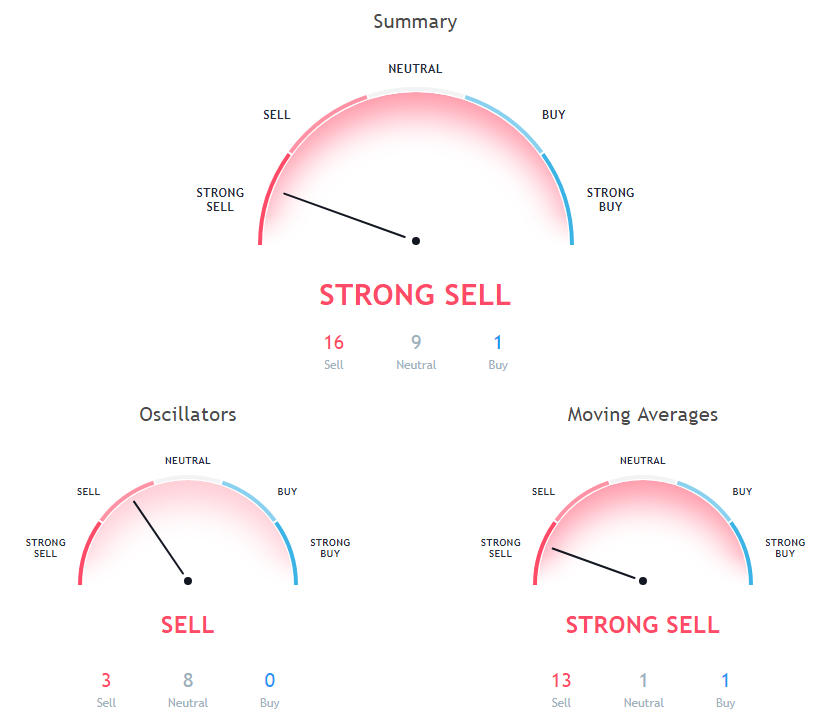
Relative Strength Index (RSI) is an important indicator that measures speed and change of price movements. Its value ranges between zero and 100. Value around 30 and below is considered oversold region and around 70 and above considered overbought regions. Relative Strength Index is indicating Neutral action, with value at 42.176.
The stochastic oscillator is a momentum indicator that compares the closing price of a security with the price range over a specific period. Stochastic oscillator is showing Neutral signal, with value at 16.385.
Moving Average (MA) in simple term is just average of any subset of numbers. For example, 50 Days simple moving average is calculated at any point in chart by summing past 50 days of price and then dividing it by 50.
10 days Exponential Moving Average is indicating Sell since Litecoin is trading at $52.49, below MAs value of 53.632. 200 days Exponential Moving Average is at 83.385, showing Sell signal, Litecoin is trading below it at $52.49. 100 days Simple Moving Average is indicating Sell since Litecoin is trading at $52.49, below MAs value of 62.036.
20 days Volume Weighted Moving Average is indicating Sell action with value at 54.876, Litecoin is trading below it at $52.49. 50 days Simple Moving Average is indicating Sell since Litecoin is trading at $52.49, below MAs value of 56.268. 10 days Simple Moving Average is indicating Sell action with value at 53.584, Litecoin is trading below it at $52.49.
100 days Exponential Moving Average is at 65.759, showing Sell signal, Litecoin is trading below it at $52.49. 9 days Ichimoku Cloud Base Line is indicating Neutral action with value at 56.295, Litecoin is trading below it at $52.49. 200 days Simple Moving Average is indicating Sell since Litecoin is trading at $52.49, below MAs value of 89.798.
20 days Simple Moving Average is indicating Sell since Litecoin is trading at $52.49, below MAs value of 54.734. 30 days Exponential Moving Average is indicating Sell action with value at 55.471, Litecoin is trading below it at $52.49. 9 days Hull Moving Average is at 52.79, showing Buy signal, Litecoin is trading below it at $52.49.
Also Read: A Complete Trezor Review & Step-by-Step Setup Guide
50 days Exponential Moving Average is indicating Sell since Litecoin is trading at $52.49, below MAs value of 57.353. 20 days Exponential Moving Average is indicating Sell action with value at 54.642, Litecoin is trading below it at $52.49. 30 days Simple Moving Average is indicating Sell action with value at 56.517, Litecoin is trading below it at $52.49.
Other Technical Price Analysis for today:
Cardano (ADA) Price Is At Risk Of A Downside Break- Cardano Price Analysis - 26 Oct 2018

