


Bitcoin (BTC) Price Predictions / Bitcoin (BTC) Forecast
| After | Price | Change |
|---|---|---|
| 1 day | $6,530.7630 | 0.85% |
| 1 week | $6,533.8962 | 0.89% |
| 1 month | $6,480.8393 | 0.07% |
| 6 months | $7,001.1148 | 8.11% |
| 1 year | $9,327.6005 | 44.03% |
| 5 years | $24,086.4405 | 271.93% |
The Relative Strength Index (RSI) is an important indicator for measuring the speed and variation of price movements. Its value ranges from zero and 100. The value around 30 and below is considered an oversold region and over 70 as oversold regions. Relative Strength Index is indicating Neutral action, with value at 49.3.
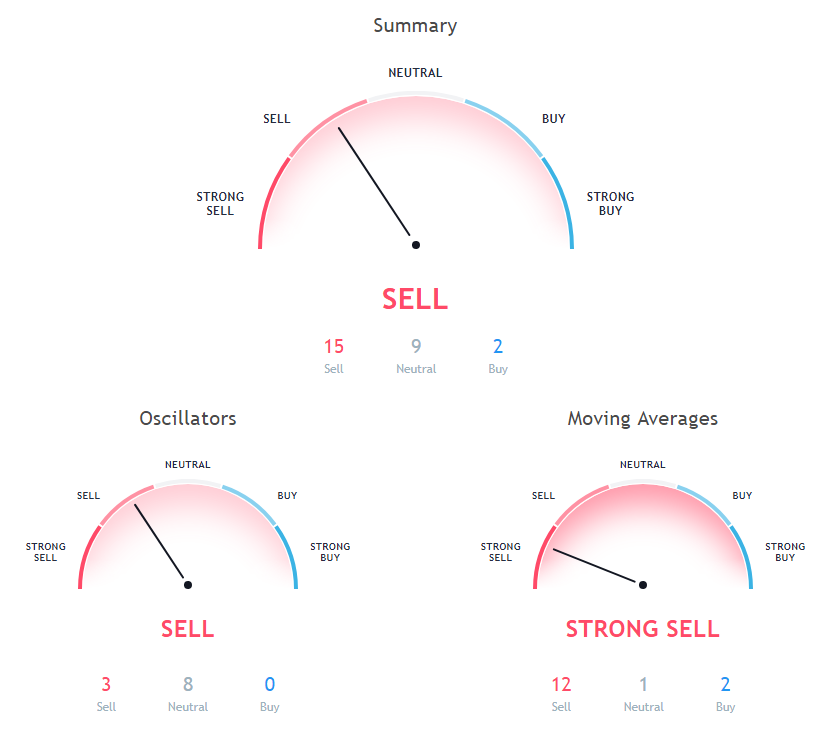
The stochastic oscillator is a momentum indicator that compares the closing price of a security with the price range over a specific period. Stochastic oscillator is indicating Neutral action, with value at 19.6.
The Commodity Channel Index (CCI) is a momentum oscillator used in technical analysis to measure an instrument's deviation from its statistical average. Commodity Channel Index is indicating Neutral action, with value at -1.4.
10 days Exponential Moving Average is at 6559.7, showing Sell signal, Bitcoin is trading below it at $6476.04. 20 days Exponential Moving Average is indicating Sell action with value at 6561.4, Bitcoin is trading below it at $6476.04. 200 days Exponential Moving Average is indicating Sell since Bitcoin is trading at $6476.04, below MAs value of 7135.9.
100 days Simple Moving Average is indicating Sell since Bitcoin is trading at $6476.04, below MAs value of 6777.6. 20 days Simple Moving Average is at 6553.8, showing Sell signal, Bitcoin is trading below it at $6476.04. 50 days Simple Moving Average is indicating Buy action with value at 6519.6, Bitcoin is trading below it at $6476.04.
9 days Ichimoku Cloud Base Line is indicating Neutral action with value at 7004.2, Bitcoin is trading below it at $6476.04. 50 days Exponential Moving Average is indicating Sell action with value at 6593, Bitcoin is trading below it at $6476.04. 200 days Simple Moving Average is at 7195.4, showing Sell signal, Bitcoin is trading below it at $6476.04.
9 days Hull Moving Average is at 6533.2, showing Buy signal, Bitcoin is trading below it at $6476.04. 30 days Exponential Moving Average is indicating Sell action with value at 6565.8, Bitcoin is trading below it at $6476.04. 30 days Simple Moving Average is indicating Sell action with value at 6569.3, Bitcoin is trading below it at $6476.04.
Also Read: Bitcoin Mining Pools
10 days Simple Moving Average is at 6579.8, showing Sell signal, Bitcoin is trading below it at $6476.04. 100 days Exponential Moving Average is indicating Sell since Bitcoin is trading at $6476.04, below MAs value of 6752. 20 days Volume Weighted Moving Average is indicating Sell since Bitcoin is trading at $6476.04, below MAs value of 6574.6.
Other Technical Price Analysis for today:
Litecoin (LTC) Prices Show Bearish Trend- Litecoin Price Analysis - 26 Oct 2018
Cardano (ADA) Price Is At Risk Of A Downside Break- Cardano Price Analysis - 26 Oct 2018

