


Litecoin (LTC) Price Predictions / Litecoin (LTC) Forecast
| After | Price | Change |
|---|---|---|
| 1 day | $53.6223 | 0.87% |
| 1 week | $53.3864 | 0.43% |
| 1 month | $54.6625 | 2.83% |
| 6 months | $74.9294 | 40.95% |
| 1 year | $122.0534 | 129.60% |
| 5 years | $337.2329 | 534.37% |
We've applied Technical Analysis to the price of Litecoin (LTC/USD) for today and predict where price is headed.
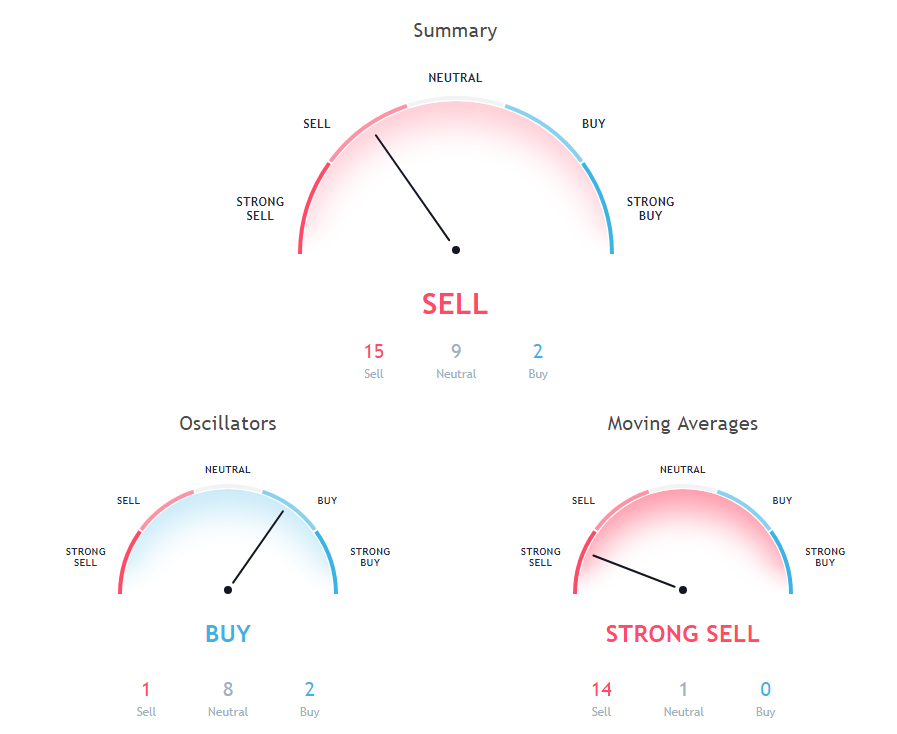
Relative Strength Index (RSI) is an important indicator that measures speed and change of price movements. Its value ranges between zero and 100. Value around 30 and below is considered oversold region and around 70 and above considered overbought regions. Relative Strength Index is at 41.727, indicating Neutral action.
The Commodity Channel Index (CCI) is a momentum-based technical trading tool used to determine when a market is overbought or oversold. Commodity Channel Index is showing Neutral signal, with value at -67.638.
The stochastic oscillator is a momentum indicator that compares the closing price of a security with the price range over a specific period. Stochastic oscillator is at 34.832, indicating Neutral action.
10 days Simple Moving Average is at 54.106, showing Sell signal, Litecoin is trading below it at $53.16. 20 days Exponential Moving Average is indicating Sell action with value at 56.238, Litecoin is trading below it at $53.16. 9 days Hull Moving Average is indicating Sell since Litecoin is trading at $53.16, below MAs value of 53.608.
50 days Exponential Moving Average is indicating Sell action with value at 62.318, Litecoin is trading below it at $53.16. 200 days Simple Moving Average is at 107.536, showing Sell signal, Litecoin is trading below it at $53.16. 20 days Simple Moving Average is indicating Sell since Litecoin is trading at $53.16, below MAs value of 57.378.
200 days Exponential Moving Average is indicating Sell since Litecoin is trading at $53.16, below MAs value of 95.325. 10 days Exponential Moving Average is indicating Sell since Litecoin is trading at $53.16, below MAs value of 54.673. 50 days Simple Moving Average is indicating Sell since Litecoin is trading at $53.16, below MAs value of 60.129.
30 days Exponential Moving Average is indicating Sell since Litecoin is trading at $53.16, below MAs value of 57.955. 100 days Simple Moving Average is at 72.598, showing Sell signal, Litecoin is trading below it at $53.16. 9 days Ichimoku Cloud Base Line is at 58.297, showing Neutral signal, Litecoin is trading below it at $53.16.
Also Read: Best Cryptocurrency To Invest in 2018 with Detailed Analysis
100 days Exponential Moving Average is indicating Sell action with value at 75.976, Litecoin is trading below it at $53.16. 30 days Simple Moving Average is indicating Sell since Litecoin is trading at $53.16, below MAs value of 57.83. 20 days Volume Weighted Moving Average is indicating Sell since Litecoin is trading at $53.16, below MAs value of 56.812.
Other Technical Price Analysis for today:
Bitcoin (BTC/USD) Price Prediction via Technical Analysis for 19 September 2018
Ethereum (ETH/USD) Price Prediction via Technical Analysis for 19 September 2018

