


In this post, we're going to apply Technical Analysis to Litecoin price chart and try to predict where its price is headed.
Litecoin stays on the sustained downtrend
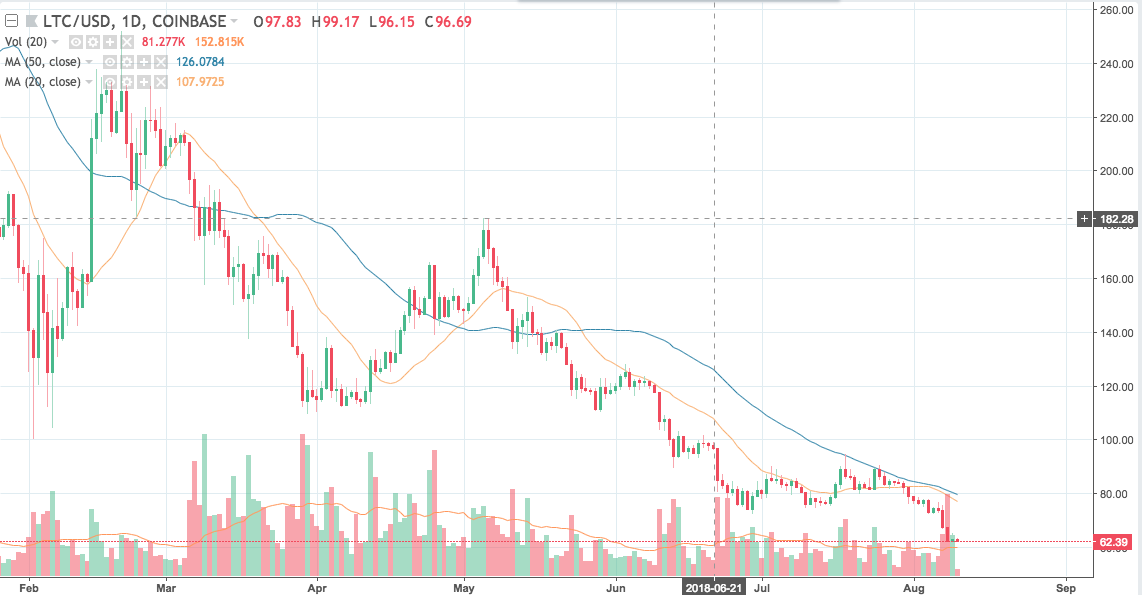
Litecoin has been on a downtrend since the start of the year. Below chart shows that It has stayed below its 50-day moving average and 20-day moving averages for most of this downtrend.
All major support in range broken down
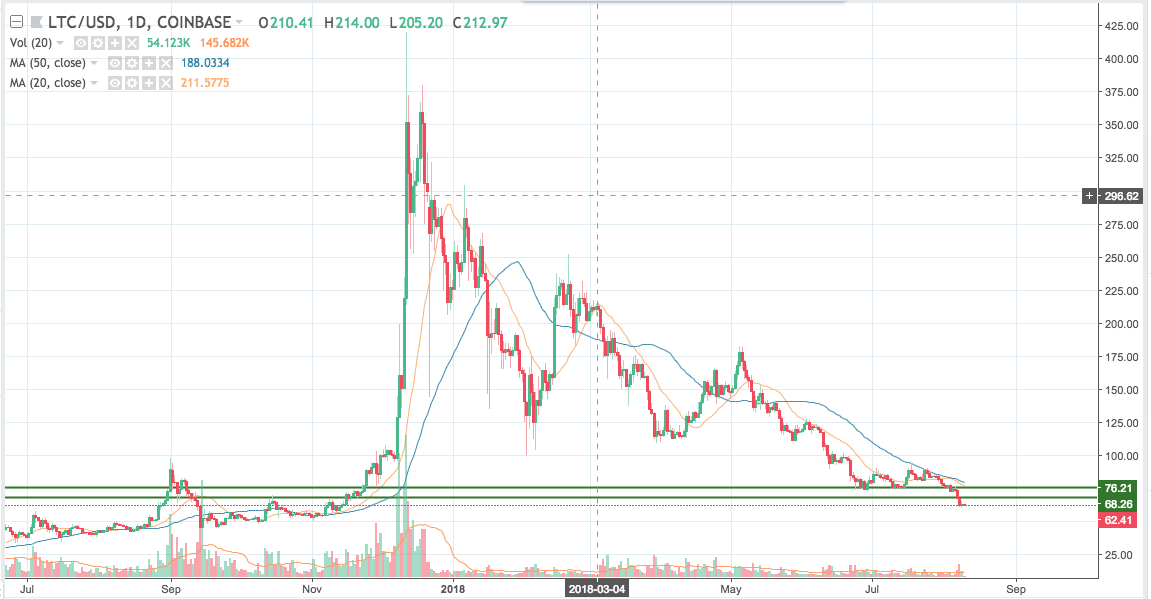
Litecoin has broken all major support in range of 78-68 at 76,74,72 and 78. Importantly, it broke them down before ETF Delay news that led the whole crypto market down a few days ago. Litecoin has since tested low at 61 and bounced back weakly at its current trading levels of 62.5.
Sell on rally till it's below 20-day moving average
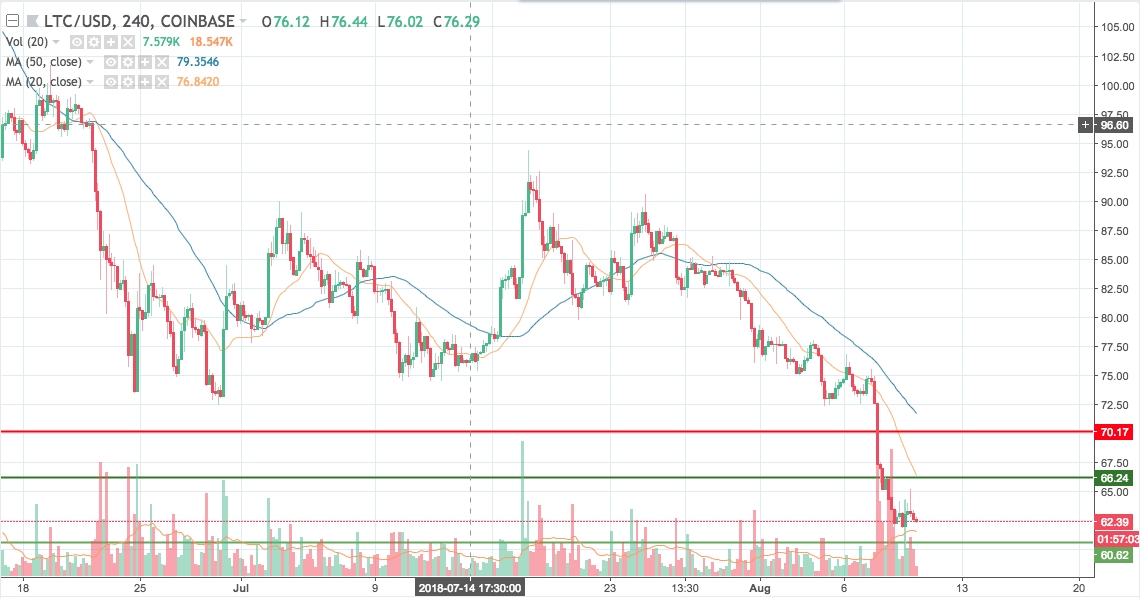
This time, we think a dynamic trading strategy for Litecoin is better than a static trade. Below is a 4-hour chart. as you can see, it's staying below it's 20-day moving average in the recent downtrend. We think going short on a rally to it's 20-day MA with StopLoss at 50-day MA is a good dynamic strategy. Below we've explored one such trade based on current setup, with trade initiation at levels close to 66, StopLoss at levels of 70 and Target at levels of 60. Risk-reward for this trade will be ~1:1.5. However, we think following this strategy can work well until Litecoin stays below its 50-day moving average. So, we will be going short on every bounce back to the levels close to 20-day MA, keeping SL at levels of 50-day MA.
Disclaimer: Views expressed here are those of the author and aren’t an investment or trading advice. Trading involves risk and so do your due diligence before making a trading decision.

