


Technical analysis is a sub-discipline of trading which is used to evaluate securities with various tools and identify trading opportunities.
Ethereum (ETH) Price Predictions / Ethereum (ETH) Forecast
| After | Price | Change |
|---|---|---|
| 1 day | $223.3075 | 0.48% |
| 1 week | $224.8167 | 1.16% |
| 1 month | $232.5595 | 4.65% |
| 6 months | $325.3320 | 46.39% |
| 1 year | $484.0839 | 117.83% |
| 5 years | $1,644.9489 | 640.20% |
We've applied Technical Analysis to the price of Ethereum (ETH/USD) for today and predict where price is headed.
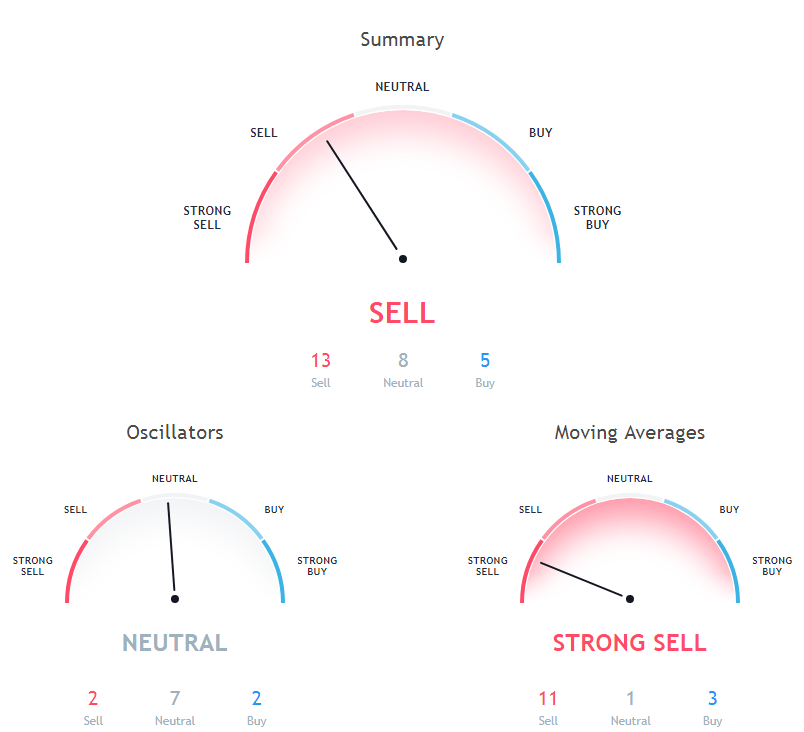
The Commodity Channel Index (CCI) is a momentum oscillator used in technical analysis to measure an instrument's deviation from its statistical average. Commodity Channel Index is at 31.96, indicating Neutral action.
The Relative Strength Index (RSI) is an important indicator for measuring the speed and variation of price movements. Its value ranges from zero and 100. The value around 30 and below is considered an oversold region and over 70 as oversold regions. Relative Strength Index is showing Neutral signal, with value at 45.55.
The stochastic oscillator is a momentum indicator that compares the closing price of a security with the price range over a specific period. Stochastic oscillator is indicating Neutral action, with value at 49.96.
9 days Hull Moving Average is indicating Buy since Ethereum is trading at $222.23, below MAs value of 217.27. 50 days Exponential Moving Average is indicating Sell since Ethereum is trading at $222.23, below MAs value of 267.83. 20 days Exponential Moving Average is at 227.93, showing Sell signal, Ethereum is trading below it at $222.23.
30 days Simple Moving Average is indicating Sell action with value at 230.33, Ethereum is trading below it at $222.23. 100 days Simple Moving Average is indicating Sell action with value at 351.62, Ethereum is trading below it at $222.23. 10 days Simple Moving Average is indicating Sell action with value at 228.13, Ethereum is trading below it at $222.23.
20 days Simple Moving Average is indicating Buy action with value at 215.43, Ethereum is trading below it at $222.23. 50 days Simple Moving Average is indicating Sell action with value at 254.46, Ethereum is trading below it at $222.23. 10 days Exponential Moving Average is at 224.45, showing Sell signal, Ethereum is trading below it at $222.23.
Also Read: Ethereum Mining Rigs
20 days Volume Weighted Moving Average is indicating Buy action with value at 212.8, Ethereum is trading below it at $222.23. 9 days Ichimoku Cloud Base Line is at 231.91, showing Neutral signal, Ethereum is trading below it at $222.23. 200 days Exponential Moving Average is indicating Sell since Ethereum is trading at $222.23, below MAs value of 428.43.
200 days Simple Moving Average is at 463.59, showing Sell signal, Ethereum is trading below it at $222.23. 30 days Exponential Moving Average is at 238.44, showing Sell signal, Ethereum is trading below it at $222.23. 100 days Exponential Moving Average is indicating Sell action with value at 341.48, Ethereum is trading below it at $222.23.
Other Technical Price Analysis for today:
Bitcoin (BTC/USD) Price Prediction via Technical Analysis for 28 September 2018
EOS (EOS/USD) Price Prediction via Technical Analysis for 28 September 2018
Litecoin (LTC/USD) Price Prediction via Technical Analysis for 28 September 2018

