


Bitcoin (BTC) Price Predictions / Bitcoin (BTC) Forecast
| After | Price | Change |
|---|---|---|
| 1 day | $6,351.2806 | 0.77% |
| 1 week | $6,383.7443 | 1.28% |
| 1 month | $6,322.8463 | 0.32% |
| 6 months | $6,789.4120 | 7.72% |
| 1 year | $9,176.6449 | 45.59% |
| 5 years | $23,953.1057 | 280.03% |
The Relative Strength Index (RSI) is an important indicator for measuring the speed and variation of price movements. Its value ranges from zero and 100. The value around 30 and below is considered an oversold region and over 70 as oversold regions. Relative Strength Index is showing Neutral signal, with value at 37.7.
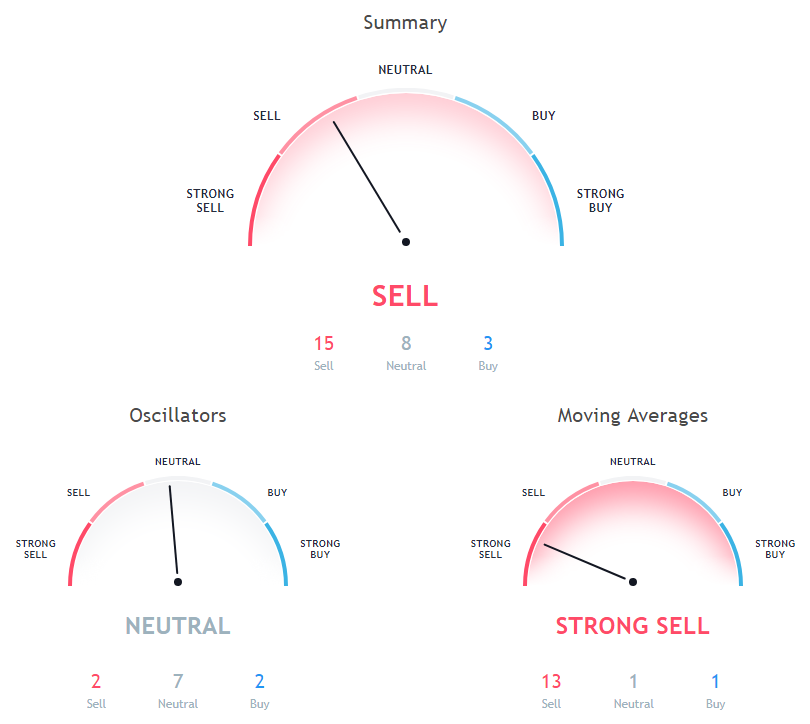
The Commodity Channel Index (CCI) is a momentum oscillator used in technical analysis to measure an instrument's deviation from its statistical average. Commodity Channel Index is at -105.1, indicating Neutral action.
The Stochastic Oscillator is a range bound momentum oscillator. Stochastic oscillator is at 5.5, indicating Neutral action.
Moving Average (MA) in simple term is just average of any subset of numbers. For example, 50 Days simple moving average is calculated at any point in chart by summing past 50 days of price and then dividing it by 50.
200 days Simple Moving Average is at 7167.4, showing Sell signal, Bitcoin is trading below it at $6302.91. 20 days Simple Moving Average is indicating Sell action with value at 6511.4, Bitcoin is trading below it at $6302.91. 10 days Exponential Moving Average is indicating Sell action with value at 6445.1, Bitcoin is trading below it at $6302.91.
30 days Exponential Moving Average is at 6516, showing Sell signal, Bitcoin is trading below it at $6302.91. 50 days Simple Moving Average is at 6530.6, showing Sell signal, Bitcoin is trading below it at $6302.91. 20 days Exponential Moving Average is indicating Sell since Bitcoin is trading at $6302.91, below MAs value of 6492.8.
20 days Volume Weighted Moving Average is indicating Sell action with value at 6581.2, Bitcoin is trading below it at $6302.91. 9 days Ichimoku Cloud Base Line is at 7004.2, showing Neutral signal, Bitcoin is trading below it at $6302.91. 100 days Exponential Moving Average is indicating Sell since Bitcoin is trading at $6302.91, below MAs value of 6717.9.
10 days Simple Moving Average is at 6473, showing Sell signal, Bitcoin is trading below it at $6302.91. 200 days Exponential Moving Average is indicating Sell since Bitcoin is trading at $6302.91, below MAs value of 7099.8. 30 days Simple Moving Average is at 6530.4, showing Sell signal, Bitcoin is trading below it at $6302.91.
Also Read: How to Short Bitcoin?
50 days Exponential Moving Average is at 6556.6, showing Sell signal, Bitcoin is trading below it at $6302.91. 100 days Simple Moving Average is indicating Sell since Bitcoin is trading at $6302.91, below MAs value of 6724.1. 9 days Hull Moving Average is at 6311.3, showing Buy signal, Bitcoin is trading below it at $6302.91.
Other Technical Price Analysis for today:
Ethereum (ETH) Price Seems To Recover Gradually - Ethereum Price Analysis - 31 Oct 2018
Bitcoin Cash (BCH) Price Remains Below $430 - Bitcoin Cash Price Analysis - 31 Oct 2018

