


Bitcoin Cash (BCH) Price Predictions / Bitcoin Cash (BCH) Forecast
| After | Price | Change |
|---|---|---|
| 1 day | $421.6458 | 0.88% |
| 1 week | $424.2023 | 1.50% |
| 1 month | $426.1976 | 1.97% |
| 6 months | $603.2998 | 44.35% |
| 1 year | $1,016.1805 | 143.13% |
| 5 years | $3,379.5987 | 708.61% |
The Relative Strength Index (RSI) is an important indicator for measuring the speed and variation of price movements. Its value ranges from zero and 100. The value around 30 and below is considered an oversold region and over 70 as oversold regions. Relative Strength Index is at 35.2, indicating Neutral action.
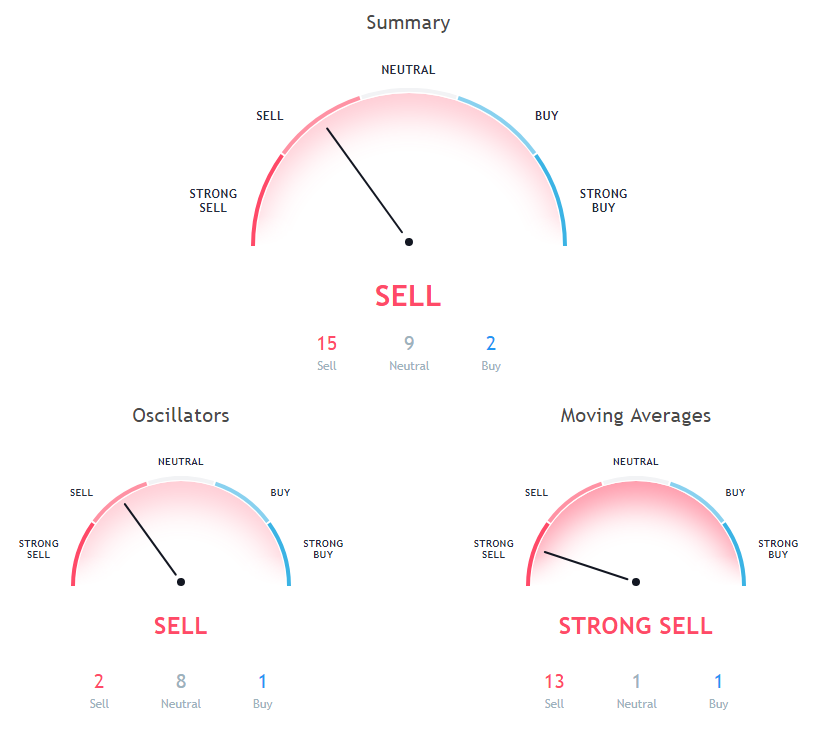
The stochastic oscillator is a momentum indicator that compares the closing price of a security with the price range over a specific period. Stochastic oscillator is at 10.8, indicating Neutral action.
The Commodity Channel Index (CCI) is a momentum oscillator used in technical analysis to measure an instrument's deviation from its statistical average. Commodity Channel Index is showing Neutral signal, with value at -179.4.
100 days Simple Moving Average is at 542.6, showing Sell signal, Bitcoin Cash is trading below it at $417.95. 10 days Exponential Moving Average is at 436.1, showing Sell signal, Bitcoin Cash is trading below it at $417.95. 10 days Simple Moving Average is at 438.6, showing Sell signal, Bitcoin Cash is trading below it at $417.95.
9 days Hull Moving Average is indicating Buy action with value at 418, Bitcoin Cash is trading below it at $417.95. 30 days Simple Moving Average is indicating Sell action with value at 468.5, Bitcoin Cash is trading below it at $417.95. 9 days Ichimoku Cloud Base Line is at 475.1, showing Neutral signal, Bitcoin Cash is trading below it at $417.95.
50 days Simple Moving Average is indicating Sell since Bitcoin Cash is trading at $417.95, below MAs value of 472.9. 30 days Exponential Moving Average is indicating Sell action with value at 460.3, Bitcoin Cash is trading below it at $417.95. 20 days Exponential Moving Average is at 449.5, showing Sell signal, Bitcoin Cash is trading below it at $417.95.
20 days Volume Weighted Moving Average is indicating Sell action with value at 452.9, Bitcoin Cash is trading below it at $417.95. 50 days Exponential Moving Average is at 482.8, showing Sell signal, Bitcoin Cash is trading below it at $417.95. 200 days Exponential Moving Average is indicating Sell action with value at 695.2, Bitcoin Cash is trading below it at $417.95.
Also Read: Future of Cryptocurrencies
20 days Simple Moving Average is indicating Sell since Bitcoin Cash is trading at $417.95, below MAs value of 446.7. 100 days Exponential Moving Average is indicating Sell action with value at 560.7, Bitcoin Cash is trading below it at $417.95. 200 days Simple Moving Average is indicating Sell action with value at 788.5, Bitcoin Cash is trading below it at $417.95.
Other Technical Price Analysis for today:
Bitcoin (BTC) Bears Trend Back Below $6400 - Bitcoin Price Analysis - 31 Oct 2018
Ethereum (ETH) Price Seems To Recover Gradually - Ethereum Price Analysis - 31 Oct 2018

