


Ethereum (ETH) Price Predictions / Ethereum (ETH) Forecast
| After | Price | Change |
|---|---|---|
| 1 day | $196.8920 | 0.67% |
| 1 week | $198.9164 | 1.70% |
| 1 month | $197.6098 | 1.03% |
| 6 months | $297.8335 | 52.27% |
| 1 year | $460.9559 | 135.67% |
| 5 years | $1,592.2713 | 714.09% |
The Commodity Channel Index (CCI) is a momentum oscillator used in technical analysis to measure an instrument's deviation from its statistical average. Commodity Channel Index is showing Neutral signal, with value at -120.35.
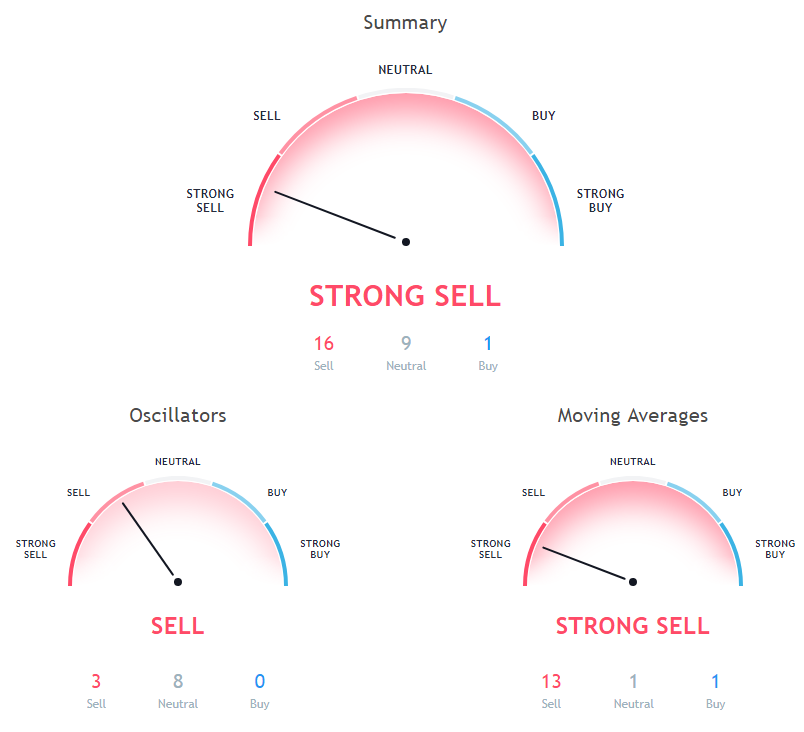
Relative Strength Index (RSI) is an important indicator that measures speed and change of price movements. Its value ranges between zero and 100. Value around 30 and below is considered oversold region and around 70 and above considered overbought regions. Relative Strength Index is at 37.93, indicating Neutral action.
The Stochastic Oscillator is a range bound momentum oscillator. Stochastic oscillator is at 8.66, indicating Neutral action.
Moving Average (MA) is just average of any subset of numbers. For example, to calculate a basic 10-day moving average you would add up the closing prices from the past 10 days and then divide the result by 10.
50 days Simple Moving Average is indicating Sell action with value at 214.84, Ethereum is trading below it at $195.59. 20 days Simple Moving Average is at 204.52, showing Sell signal, Ethereum is trading below it at $195.59. 50 days Exponential Moving Average is indicating Sell action with value at 224.7, Ethereum is trading below it at $195.59.
30 days Simple Moving Average is indicating Sell since Ethereum is trading at $195.59, below MAs value of 210.54. 30 days Exponential Moving Average is at 210.52, showing Sell signal, Ethereum is trading below it at $195.59. 20 days Volume Weighted Moving Average is indicating Sell action with value at 206.81, Ethereum is trading below it at $195.59.
9 days Ichimoku Cloud Base Line is at 215.49, showing Neutral signal, Ethereum is trading below it at $195.59. 200 days Simple Moving Average is indicating Sell action with value at 419.82, Ethereum is trading below it at $195.59. 200 days Exponential Moving Average is indicating Sell since Ethereum is trading at $195.59, below MAs value of 367.47.
10 days Exponential Moving Average is indicating Sell action with value at 201.92, Ethereum is trading below it at $195.59. 9 days Hull Moving Average is indicating Buy action with value at 196.5, Ethereum is trading below it at $195.59. 10 days Simple Moving Average is at 202.68, showing Sell signal, Ethereum is trading below it at $195.59.
Also Read: A Complete Trezor Review & Step-by-Step Setup Guide
100 days Exponential Moving Average is indicating Sell action with value at 278.27, Ethereum is trading below it at $195.59. 20 days Exponential Moving Average is indicating Sell action with value at 205.97, Ethereum is trading below it at $195.59. 100 days Simple Moving Average is indicating Sell action with value at 270.09, Ethereum is trading below it at $195.59.
Other Technical Price Analysis for today:
Bitcoin (BTC) Bears Trend Back Below $6400 - Bitcoin Price Analysis - 31 Oct 2018
Bitcoin Cash (BCH) Price Remains Below $430 - Bitcoin Cash Price Analysis - 31 Oct 2018

