


Technical analysis is a sub-discipline of trading which is used to evaluate securities with various tools and identify trading opportunities.
Bitcoin (BTC) Price Predictions / Bitcoin (BTC) Forecast
| After | Price | Change |
|---|---|---|
| 1 day | $6,613.8846 | 0.56% |
| 1 week | $6,637.5806 | 0.92% |
| 1 month | $6,606.8366 | 0.45% |
| 6 months | $7,189.2429 | 9.31% |
| 1 year | $9,489.4620 | 44.28% |
| 5 years | $24,107.1594 | 266.54% |
We've applied Technical Analysis to the price of Bitcoin (BTC/USD) for today and predict where price is headed.
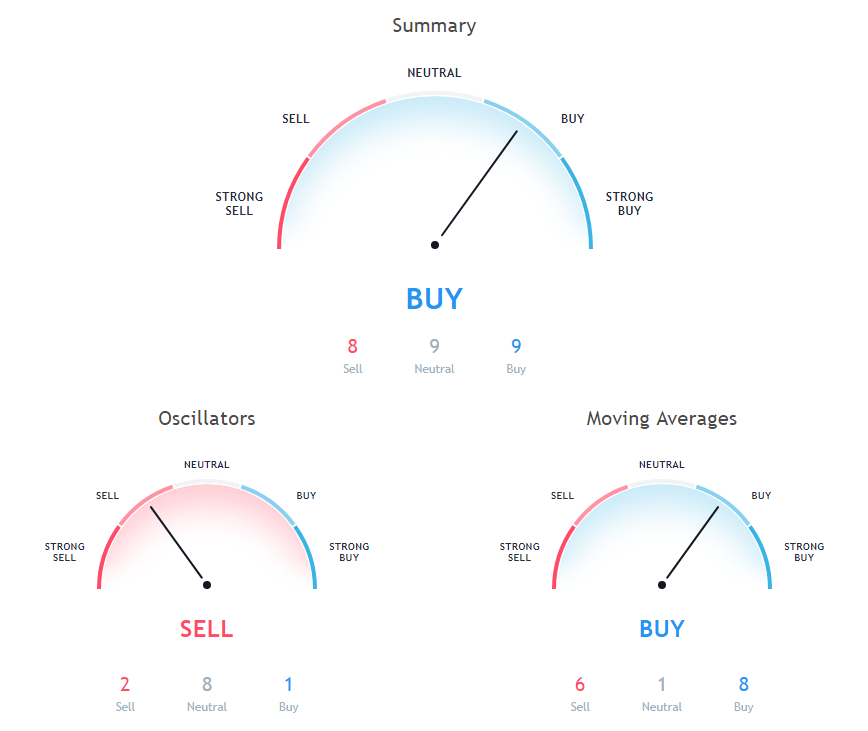
The Stochastic Oscillator is a range bound momentum oscillator. Stochastic oscillator is indicating Neutral action, with value at 45.3.
Relative Strength Index (RSI) is an important indicator that measures speed and change of price movements. Its value ranges between zero and 100. Value around 30 and below is considered oversold region and around 70 and above considered overbought regions. Relative Strength Index is indicating Neutral action, with value at 50.4.
The Commodity Channel Index (CCI) is a momentum-based technical trading tool used to determine when a market is overbought or oversold. Commodity Channel Index is indicating Neutral action, with value at 23.6.
200 days Exponential Moving Average is at 7270.9, showing Sell signal, Bitcoin is trading below it at $6577.01. 50 days Simple Moving Average is indicating Sell action with value at 6617, Bitcoin is trading below it at $6577.01. 30 days Simple Moving Average is indicating Buy since Bitcoin is trading at $6577.01, below MAs value of 6492.4.
9 days Hull Moving Average is at 6539.6, showing Buy signal, Bitcoin is trading below it at $6577.01. 10 days Exponential Moving Average is indicating Buy since Bitcoin is trading at $6577.01, below MAs value of 6572.6. 10 days Simple Moving Average is at 6581.9, showing Buy signal, Bitcoin is trading below it at $6577.01.
50 days Exponential Moving Average is at 6637.9, showing Sell signal, Bitcoin is trading below it at $6577.01. 20 days Volume Weighted Moving Average is at 6548.3, showing Buy signal, Bitcoin is trading below it at $6577.01. 20 days Exponential Moving Average is at 6571, showing Buy signal, Bitcoin is trading below it at $6577.01.
9 days Ichimoku Cloud Base Line is indicating Neutral since Bitcoin is trading at $6577.01, below MAs value of 6470.5. 100 days Exponential Moving Average is indicating Sell action with value at 6853, Bitcoin is trading below it at $6577.01. 200 days Simple Moving Average is indicating Sell action with value at 7302.8, Bitcoin is trading below it at $6577.01.
Also Read: List of places accepting Bitcoins
20 days Simple Moving Average is at 6550.6, showing Buy signal, Bitcoin is trading below it at $6577.01. 100 days Simple Moving Average is indicating Sell action with value at 6769.9, Bitcoin is trading below it at $6577.01. 30 days Exponential Moving Average is at 6585.3, showing Buy signal, Bitcoin is trading below it at $6577.01.
Other Technical Price Analysis for today:
Ripple (XRP) Anticipates Another Bull Run Near $0.5450 - Ripple Price Analysis - 5 Oct 2018
Ethereum (ETH) Shows Positive Signs and Moves Towards $230 - Ethereum Price Analysis - 5 Oct 2018

