


Bitcoin (BTC) Price Predictions / Bitcoin (BTC) Forecast
| After | Price | Change |
|---|---|---|
| 1 day | $4,042.3363 | 0.57% |
| 1 week | $4,079.8033 | 1.50% |
| 1 month | $4,231.4460 | 5.27% |
| 6 months | $4,632.5985 | 15.25% |
| 1 year | $7,066.0989 | 75.80% |
| 5 years | $21,847.6857 | 443.55% |
The Commodity Channel Index (CCI) is a momentum-based technical trading tool used to determine when a market is overbought or oversold. Commodity Channel Index is showing Neutral signal, with value at -66.
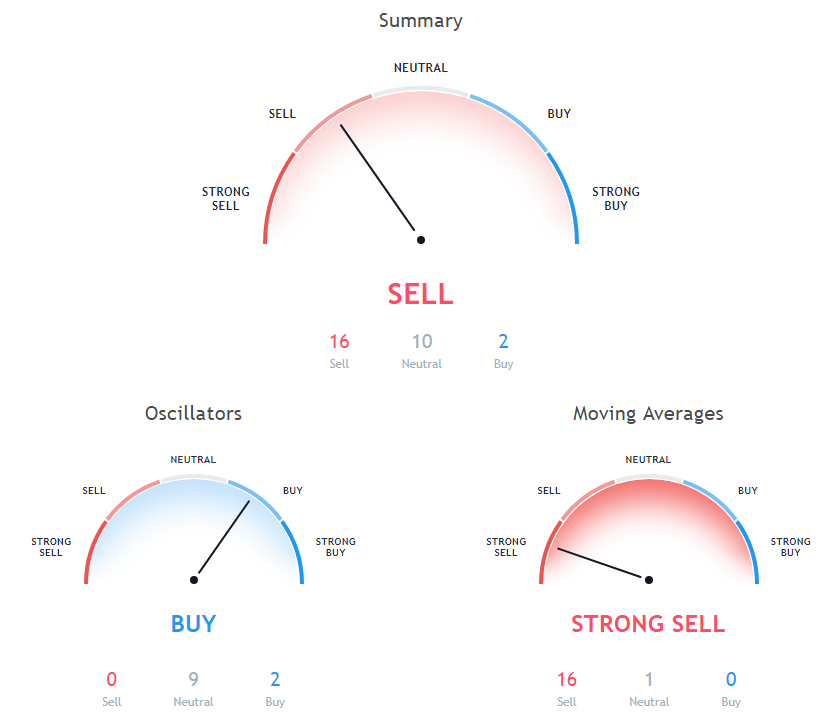
The stochastic oscillator is a momentum indicator that compares the closing price of a security with the price range over a specific period. Stochastic oscillator is indicating Neutral action, with value at 27.1.
The Relative Strength Index (RSI) is an important indicator for measuring the speed and variation of price movements. Its value ranges from zero and 100. The value around 30 and below is considered an oversold region and over 70 as oversold regions. Relative Strength Index is indicating Neutral action, with value at 30.8.
Moving Average (MA) in simple term is just average of any subset of numbers. For example, 50 Days simple moving average is calculated at any point in chart by summing past 50 days of price and then dividing it by 50.
50 days Simple Moving Average is at 5754.4, showing Sell signal, Bitcoin is trading below it at $4019.44. 30 days Simple Moving Average is indicating Sell action with value at 5239.6, Bitcoin is trading below it at $4019.44. 20 days Volume Weighted Moving Average is indicating Sell action with value at 4553.2, Bitcoin is trading below it at $4019.44.
100 days Simple Moving Average is at 6184.8, showing Sell signal, Bitcoin is trading below it at $4019.44. 9 days Hull Moving Average is indicating Sell action with value at 4174, Bitcoin is trading below it at $4019.44. 5 days Exponential Moving Average is indicating Sell since Bitcoin is trading at $4019.44, below MAs value of 4133.5.
10 days Exponential Moving Average is indicating Sell since Bitcoin is trading at $4019.44, below MAs value of 4246.1. 9 days Ichimoku Cloud Base Line is at 5121.3, showing Neutral signal, Bitcoin is trading below it at $4019.44. 20 days Exponential Moving Average is at 4633, showing Sell signal, Bitcoin is trading below it at $4019.44.
20 days Simple Moving Average is at 4622.6, showing Sell signal, Bitcoin is trading below it at $4019.44. 100 days Exponential Moving Average is indicating Sell since Bitcoin is trading at $4019.44, below MAs value of 5966.1. 30 days Exponential Moving Average is indicating Sell action with value at 4966.1, Bitcoin is trading below it at $4019.44.
10 days Simple Moving Average is indicating Sell action with value at 4089.1, Bitcoin is trading below it at $4019.44. 200 days Simple Moving Average is at 6578.5, showing Sell signal, Bitcoin is trading below it at $4019.44. 5 days Simple Moving Average is indicating Sell since Bitcoin is trading at $4019.44, below MAs value of 4164.
Also Read: How to Short Bitcoin?
50 days Exponential Moving Average is indicating Sell since Bitcoin is trading at $4019.44, below MAs value of 5404.5. 200 days Exponential Moving Average is indicating Sell action with value at 6581, Bitcoin is trading below it at $4019.44.
Other Technical Price Analysis for today:
Cardano (ADA) Price Remains Supported Near $0.0395 - Cardano Price Analysis - 3 Dec 2018

