


Bitcoin Cash (BCH) Price Predictions / Bitcoin Cash (BCH) Forecast
| After | Price | Change |
|---|---|---|
| 1 day | $450.9655 | 0.49% |
| 1 week | $449.9309 | 0.26% |
| 1 month | $449.6171 | 0.19% |
| 6 months | $639.3616 | 42.47% |
| 1 year | $1,036.9470 | 131.07% |
| 5 years | $3,407.3924 | 659.29% |
The Commodity Channel Index (CCI) is a momentum-based technical trading tool used to determine when a market is overbought or oversold. Commodity Channel Index is at -49.6, indicating Neutral action.
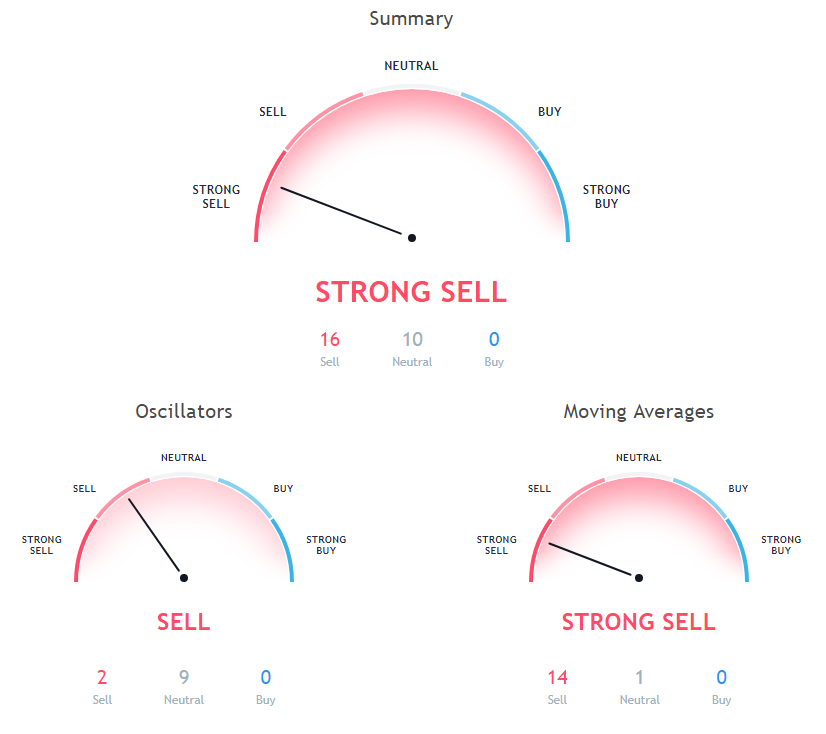
The stochastic oscillator is a momentum indicator that compares the closing price of a security with the price range over a specific period. Stochastic oscillator is indicating Neutral action, with value at 24.4.
The Relative Strength Index (RSI) is an important indicator for measuring the speed and variation of price movements. Its value ranges from zero and 100. The value around 30 and below is considered an oversold region and over 70 as oversold regions. Relative Strength Index is indicating Neutral action, with value at 42.6.
100 days Simple Moving Average is indicating Sell action with value at 568.5, Bitcoin Cash is trading below it at $448.76. 10 days Exponential Moving Average is indicating Sell action with value at 457.4, Bitcoin Cash is trading below it at $448.76. 20 days Volume Weighted Moving Average is at 468.7, showing Sell signal, Bitcoin Cash is trading below it at $448.76.
200 days Exponential Moving Average is at 714.3, showing Sell signal, Bitcoin Cash is trading below it at $448.76. 50 days Exponential Moving Average is at 499.3, showing Sell signal, Bitcoin Cash is trading below it at $448.76. 200 days Simple Moving Average is at 797.4, showing Sell signal, Bitcoin Cash is trading below it at $448.76.
20 days Simple Moving Average is indicating Sell since Bitcoin Cash is trading at $448.76, below MAs value of 473.1. 9 days Ichimoku Cloud Base Line is indicating Neutral since Bitcoin Cash is trading at $448.76, below MAs value of 495.2. 50 days Simple Moving Average is at 480.4, showing Sell signal, Bitcoin Cash is trading below it at $448.76.
20 days Exponential Moving Average is at 468.3, showing Sell signal, Bitcoin Cash is trading below it at $448.76. 30 days Exponential Moving Average is indicating Sell action with value at 477.4, Bitcoin Cash is trading below it at $448.76. 10 days Simple Moving Average is indicating Sell since Bitcoin Cash is trading at $448.76, below MAs value of 456.4.
Also Read: Ledger Nano S vs Trezor vs KeepKey: A Complete Cryptocurrency Hardware Wallet Comparison
100 days Exponential Moving Average is at 580, showing Sell signal, Bitcoin Cash is trading below it at $448.76. 30 days Simple Moving Average is indicating Sell since Bitcoin Cash is trading at $448.76, below MAs value of 489.9. 9 days Hull Moving Average is indicating Sell since Bitcoin Cash is trading at $448.76, below MAs value of 452.7.
Other Technical Price Analysis for today:
Bitcoin (BTC) Price Tries To Break Out Of Its Downtrend - Bitcoin Price Analysis - 23 Oct 2018
Ethereum (ETH) Price Is Showing Short Term Recovery Signs - Ethereum Price Analysis - 23 Oct 2018

