


Ethereum (ETH) Price Predictions / Ethereum (ETH) Forecast
| After | Price | Change |
|---|---|---|
| 1 day | $205.3081 | 0.64% |
| 1 week | $204.3613 | 0.18% |
| 1 month | $205.3399 | 0.66% |
| 6 months | $309.0334 | 51.49% |
| 1 year | $466.4543 | 128.65% |
| 5 years | $1,604.0665 | 686.31% |
Relative Strength Index (RSI) is an important indicator that measures speed and change of price movements. Its value ranges between zero and 100. Value around 30 and below is considered oversold region and around 70 and above considered overbought regions. Relative Strength Index is at 43.91, indicating Neutral action.
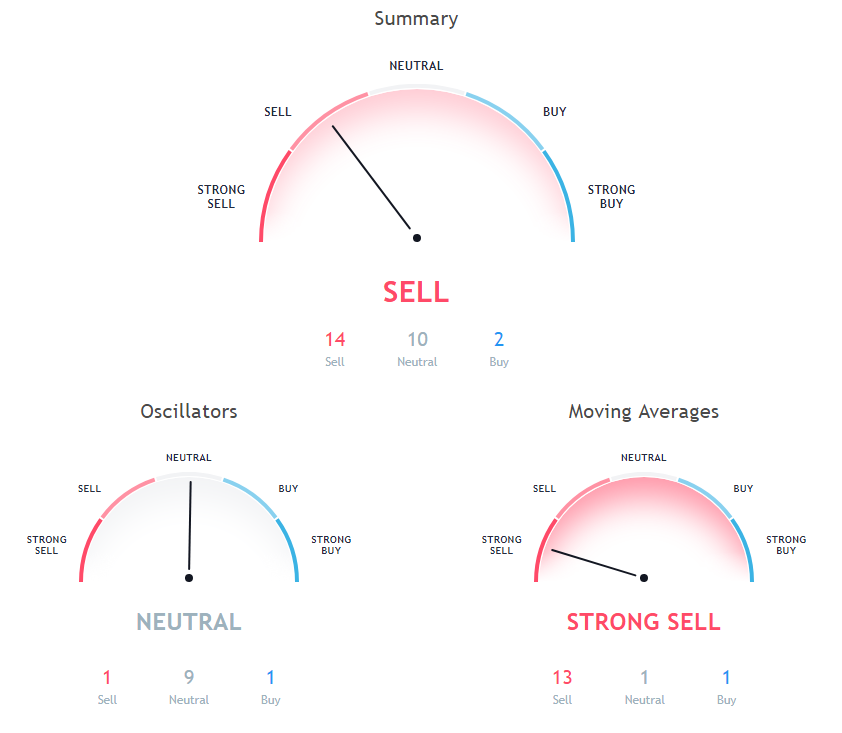
The Commodity Channel Index (CCI) is a momentum-based technical trading tool used to determine when a market is overbought or oversold. Commodity Channel Index is indicating Neutral action, with value at -36.56.
The Stochastic Oscillator is a range bound momentum oscillator. Stochastic oscillator is at 33.1, indicating Neutral action.
Moving Average (MA) in simple term is just average of any subset of numbers. For example, 50 Days simple moving average is calculated at any point in chart by summing past 50 days of price and then dividing it by 50.
9 days Ichimoku Cloud Base Line is indicating Neutral since Ethereum is trading at $204, below MAs value of 215.49. 20 days Volume Weighted Moving Average is at 209.89, showing Sell signal, Ethereum is trading below it at $204. 10 days Simple Moving Average is indicating Sell action with value at 208.77, Ethereum is trading below it at $204.
50 days Simple Moving Average is indicating Sell since Ethereum is trading at $204, below MAs value of 215.65. 30 days Exponential Moving Average is indicating Sell action with value at 216.34, Ethereum is trading below it at $204. 50 days Exponential Moving Average is indicating Sell since Ethereum is trading at $204, below MAs value of 232.39.
200 days Simple Moving Average is at 428.46, showing Sell signal, Ethereum is trading below it at $204. 9 days Hull Moving Average is indicating Buy action with value at 205.8, Ethereum is trading below it at $204. 10 days Exponential Moving Average is indicating Sell action with value at 207.86, Ethereum is trading below it at $204.
20 days Exponential Moving Average is indicating Sell since Ethereum is trading at $204, below MAs value of 211.46. 100 days Simple Moving Average is indicating Sell action with value at 288.65, Ethereum is trading below it at $204. 100 days Exponential Moving Average is indicating Sell action with value at 289.89, Ethereum is trading below it at $204.
Also Read: Introduction to ERC20 Tokens
20 days Simple Moving Average is indicating Sell since Ethereum is trading at $204, below MAs value of 211.97. 200 days Exponential Moving Average is indicating Sell action with value at 379.53, Ethereum is trading below it at $204. 30 days Simple Moving Average is indicating Sell action with value at 216.3, Ethereum is trading below it at $204.
Other Technical Price Analysis for today:
Bitcoin (BTC) Price Tries To Break Out Of Its Downtrend - Bitcoin Price Analysis - 23 Oct 2018

