


Bitcoin (BTC) Price Predictions / Bitcoin (BTC) Forecast
| After | Price | Change |
|---|---|---|
| 1 day | $6,561.4294 | 0.88% |
| 1 week | $6,523.5289 | 0.30% |
| 1 month | $6,489.8272 | -0.22% |
| 6 months | $7,028.5671 | 8.06% |
| 1 year | $9,337.3725 | 43.56% |
| 5 years | $24,085.1524 | 270.30% |
The Stochastic Oscillator is a range bound momentum oscillator. Stochastic oscillator is indicating Neutral action, with value at 22.3.
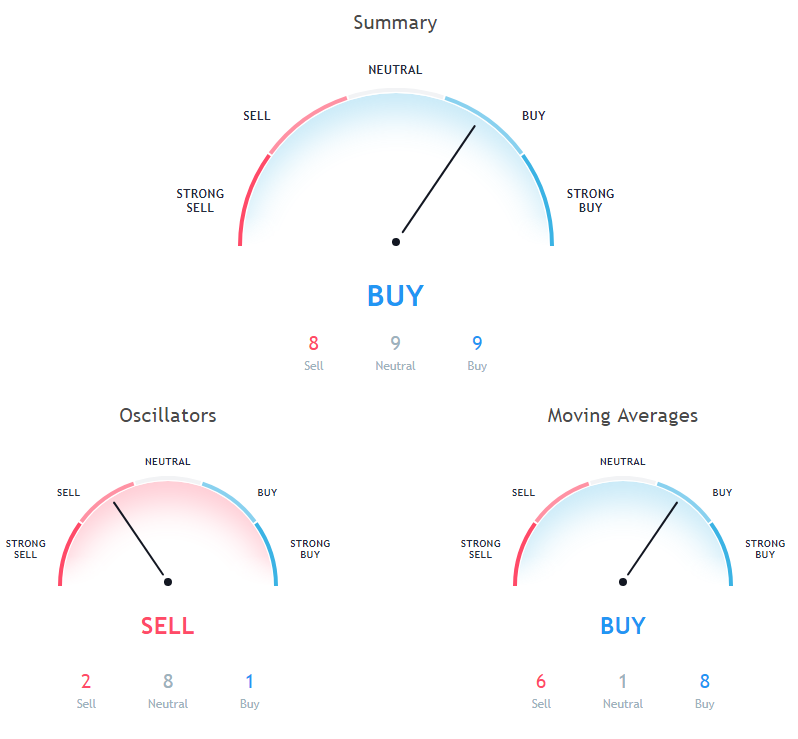
The Commodity Channel Index (CCI) is a momentum oscillator used in technical analysis to measure an instrument's deviation from its statistical average. Commodity Channel Index is indicating Neutral action, with value at 17.6.
Relative Strength Index (RSI) is an important indicator that measures speed and change of price movements. Its value ranges between zero and 100. Value around 30 and below is considered oversold region and around 70 and above considered overbought regions. Relative Strength Index is showing Neutral signal, with value at 51.2.
Moving Average (MA) in simple term is just average of any subset of numbers. For example, 50 Days simple moving average is calculated at any point in chart by summing past 50 days of price and then dividing it by 50.
200 days Exponential Moving Average is indicating Sell since Bitcoin is trading at $6504.31, below MAs value of 7148.3. 100 days Simple Moving Average is at 6794.1, showing Sell signal, Bitcoin is trading below it at $6504.31. 50 days Simple Moving Average is at 6523.1, showing Buy signal, Bitcoin is trading below it at $6504.31.
100 days Exponential Moving Average is at 6761.4, showing Sell signal, Bitcoin is trading below it at $6504.31. 9 days Ichimoku Cloud Base Line is indicating Neutral action with value at 7004.2, Bitcoin is trading below it at $6504.31. 30 days Exponential Moving Average is indicating Buy action with value at 6572, Bitcoin is trading below it at $6504.31.
20 days Simple Moving Average is indicating Buy action with value at 6563.5, Bitcoin is trading below it at $6504.31. 200 days Simple Moving Average is indicating Sell action with value at 7199.2, Bitcoin is trading below it at $6504.31. 30 days Simple Moving Average is indicating Buy action with value at 6564.8, Bitcoin is trading below it at $6504.31.
50 days Exponential Moving Average is indicating Sell since Bitcoin is trading at $6504.31, below MAs value of 6598.9. 10 days Exponential Moving Average is indicating Buy since Bitcoin is trading at $6504.31, below MAs value of 6575.9. 9 days Hull Moving Average is indicating Buy since Bitcoin is trading at $6504.31, below MAs value of 6552.8.
Also Read: Beginners Guide to Binance Cryptocurrency Exchange
20 days Exponential Moving Average is indicating Buy action with value at 6569.7, Bitcoin is trading below it at $6504.31. 20 days Volume Weighted Moving Average is indicating Buy action with value at 6580.4, Bitcoin is trading below it at $6504.31. 10 days Simple Moving Average is at 6625.3, showing Sell signal, Bitcoin is trading below it at $6504.31.
Other Technical Price Analysis for today:
Ethereum (ETH) Price Is Showing Short Term Recovery Signs - Ethereum Price Analysis - 23 Oct 2018

