


Bitcoin Cash (BCH) Price Predictions / Bitcoin Cash (BCH) Forecast
| After | Price | Change |
|---|---|---|
| 1 day | $441.4987 | 0.23% |
| 1 week | $445.6527 | 1.17% |
| 1 month | $448.6396 | 1.85% |
| 6 months | $566.8620 | 28.69% |
| 1 year | $1,044.0857 | 137.03% |
| 5 years | $3,376.8060 | 666.60% |
The Relative Strength Index (RSI) is an important indicator for measuring the speed and variation of price movements. Its value ranges from zero and 100. The value around 30 and below is considered an oversold region and over 70 as oversold regions. Relative Strength Index is indicating Neutral action, with value at 40.2.
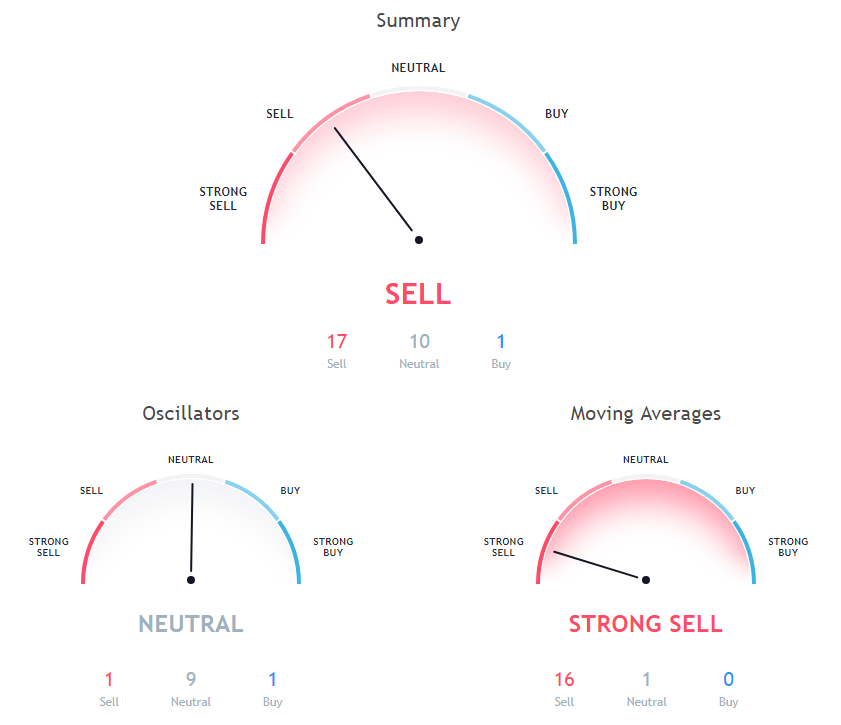
The Commodity Channel Index (CCI) is a momentum-based technical trading tool used to determine when a market is overbought or oversold. Commodity Channel Index is at -61.5, indicating Neutral action.
The stochastic oscillator is a momentum indicator that compares the closing price of a security with the price range over a specific period. Stochastic oscillator is at 25.6, indicating Neutral action.
30 days Exponential Moving Average is indicating Sell since Bitcoin Cash is trading at $440.49, below MAs value of 501.5. 200 days Simple Moving Average is indicating Sell since Bitcoin Cash is trading at $440.49, below MAs value of 741.4. 100 days Exponential Moving Average is indicating Sell since Bitcoin Cash is trading at $440.49, below MAs value of 552.3.
100 days Simple Moving Average is at 506.4, showing Sell signal, Bitcoin Cash is trading below it at $440.49. 10 days Simple Moving Average is indicating Sell since Bitcoin Cash is trading at $440.49, below MAs value of 541.4. 200 days Exponential Moving Average is at 672, showing Sell signal, Bitcoin Cash is trading below it at $440.49.
9 days Hull Moving Average is at 456.9, showing Sell signal, Bitcoin Cash is trading below it at $440.49. 10 days Exponential Moving Average is indicating Sell since Bitcoin Cash is trading at $440.49, below MAs value of 507.5. 20 days Volume Weighted Moving Average is at 531.9, showing Sell signal, Bitcoin Cash is trading below it at $440.49.
20 days Exponential Moving Average is indicating Sell since Bitcoin Cash is trading at $440.49, below MAs value of 506.3. 5 days Exponential Moving Average is indicating Sell action with value at 487.7, Bitcoin Cash is trading below it at $440.49. 50 days Exponential Moving Average is indicating Sell since Bitcoin Cash is trading at $440.49, below MAs value of 502.8.
9 days Ichimoku Cloud Base Line is indicating Neutral since Bitcoin Cash is trading at $440.49, below MAs value of 528.4. 5 days Simple Moving Average is at 495.3, showing Sell signal, Bitcoin Cash is trading below it at $440.49. 30 days Simple Moving Average is indicating Sell since Bitcoin Cash is trading at $440.49, below MAs value of 486.1.
Also Read: Everything You Need to Know About the 15th Nov. Bitcoin Cash Hard Fork
50 days Simple Moving Average is at 493.9, showing Sell signal, Bitcoin Cash is trading below it at $440.49. 20 days Simple Moving Average is indicating Sell action with value at 503.7, Bitcoin Cash is trading below it at $440.49.
Other Technical Price Analysis for today:
Bitcoin (BTC) Price Declined Heavily Towards $5,400 - Bitcoin Price Analysis - 15 Nov 2018
Ethereum (ETH) Price Traded To A New Monthly Low At $165 - Ethereum Price Analysis - 15 Nov 2018

