


Bitcoin (BTC) Price Predictions / Bitcoin (BTC) Forecast
| After | Price | Change |
|---|---|---|
| 1 day | $5,533.8311 | 0.60% |
| 1 week | $5,509.0499 | 0.15% |
| 1 month | $5,727.6838 | 4.12% |
| 6 months | $6,050.7358 | 9.99% |
| 1 year | $8,595.6959 | 56.26% |
| 5 years | $23,424.6849 | 325.83% |
The Commodity Channel Index (CCI) is a momentum oscillator used in technical analysis to measure an instrument's deviation from its statistical average. Commodity Channel Index is showing Buy signal, with value at -389.1.
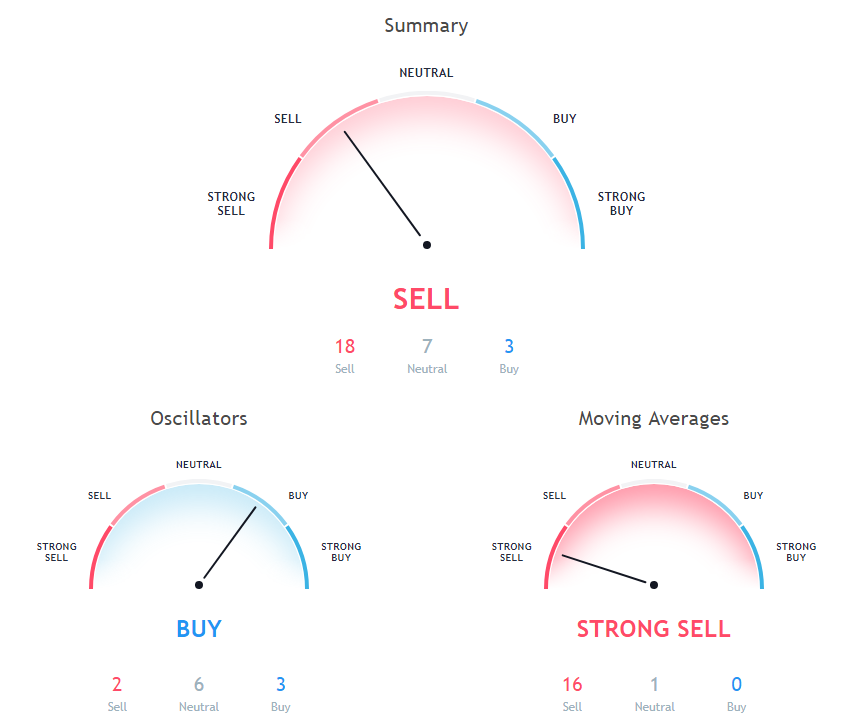
The stochastic oscillator is a momentum indicator that compares the closing price of a security with the price range over a specific period. Stochastic oscillator is showing Neutral signal, with value at 30.2.
Relative Strength Index (RSI) is an important indicator that measures speed and change of price movements. Its value ranges between zero and 100. Value around 30 and below is considered oversold region and around 70 and above considered overbought regions. Relative Strength Index is at 19.4, indicating Buy action.
10 days Simple Moving Average is at 6331.6, showing Sell signal, Bitcoin is trading below it at $5500.95. 5 days Exponential Moving Average is indicating Sell since Bitcoin is trading at $5500.95, below MAs value of 6057.9. 9 days Ichimoku Cloud Base Line is at 6106.1, showing Neutral signal, Bitcoin is trading below it at $5500.95.
100 days Simple Moving Average is indicating Sell action with value at 6526.2, Bitcoin is trading below it at $5500.95. 200 days Exponential Moving Average is indicating Sell action with value at 6997.1, Bitcoin is trading below it at $5500.95. 30 days Exponential Moving Average is indicating Sell since Bitcoin is trading at $5500.95, below MAs value of 6394.4.
100 days Exponential Moving Average is at 6624.2, showing Sell signal, Bitcoin is trading below it at $5500.95. 5 days Simple Moving Average is indicating Sell since Bitcoin is trading at $5500.95, below MAs value of 6179.3. 50 days Exponential Moving Average is indicating Sell since Bitcoin is trading at $5500.95, below MAs value of 6460.2.
20 days Exponential Moving Average is indicating Sell action with value at 6341.3, Bitcoin is trading below it at $5500.95. 200 days Simple Moving Average is indicating Sell action with value at 6986.5, Bitcoin is trading below it at $5500.95. 20 days Simple Moving Average is indicating Sell since Bitcoin is trading at $5500.95, below MAs value of 6376.8.
9 days Hull Moving Average is at 5983.5, showing Sell signal, Bitcoin is trading below it at $5500.95. 50 days Simple Moving Average is indicating Sell since Bitcoin is trading at $5500.95, below MAs value of 6491.9. 30 days Simple Moving Average is indicating Sell since Bitcoin is trading at $5500.95, below MAs value of 6443.8.
Also Read: Best Bitcoin Cloud Mining Platforms of 2018
10 days Exponential Moving Average is at 6225.7, showing Sell signal, Bitcoin is trading below it at $5500.95. 20 days Volume Weighted Moving Average is indicating Sell since Bitcoin is trading at $5500.95, below MAs value of 6225.9.
Other Technical Price Analysis for today:
Ethereum (ETH) Price Traded To A New Monthly Low At $165 - Ethereum Price Analysis - 15 Nov 2018

