


In this post, we're going to apply Technical Analysis to Ripple (XRP) price chart and try to predict where its price is headed.
Bears aggressive after Breakdown of Descending Triangle
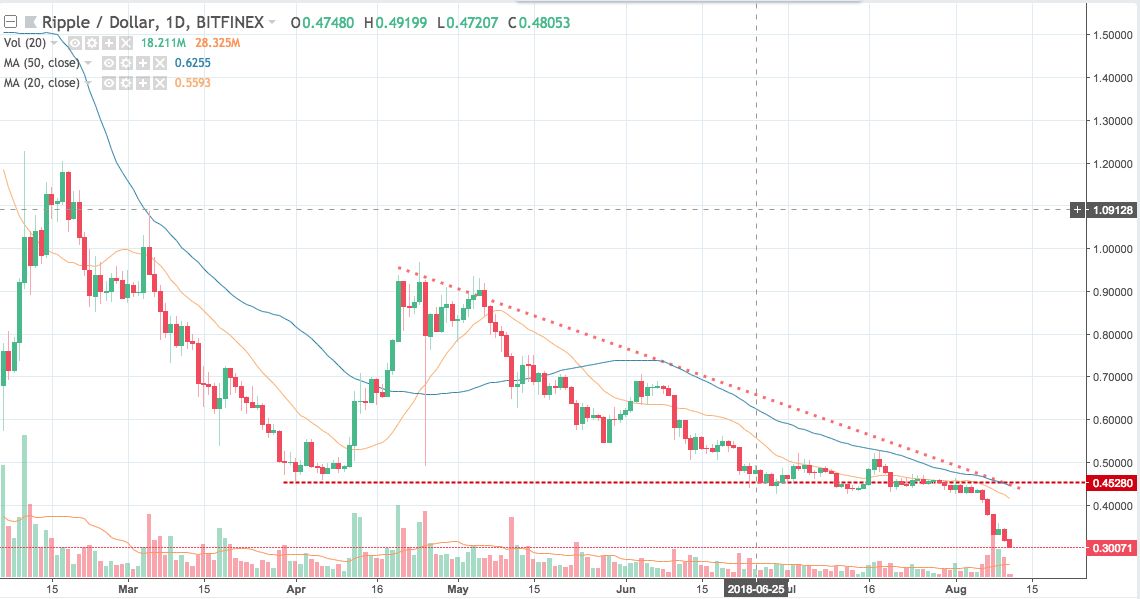
Descending Triangle is a bearish chart pattern. As we can see in the chart below, Ripple has broken down of the Descending Triangle pattern at the beginning of August, and is making downside momentum even stronger. Since then Ripple has fallen from support at $0.452 to the current levels of $0.30 without any significant pullback.
RSI into extremely oversold regions and failed to rebound
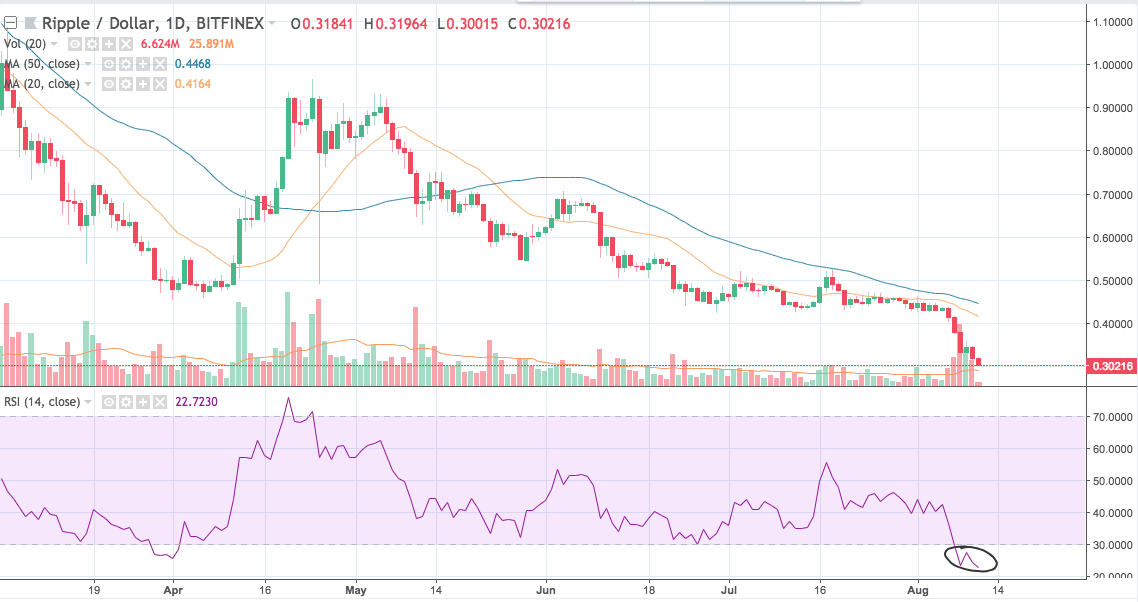
As we can see in the chart below, Relative Strength Index (RSI) has gone below 30 into extremely oversold regions. It then failed to bounce back from this level and is now headed even lower. 20-day Moving Average and 50-day Moving Averages have also turned down from flat.
Breakdown of Descending Triangle made bears confident and they have aggressively pushed the price lower. Even as that has made RSI extremely oversold, bulls have not been able to engineer any significant pullback to even test the lower line of Descending Triangle.
Wait for bullish signs before going long
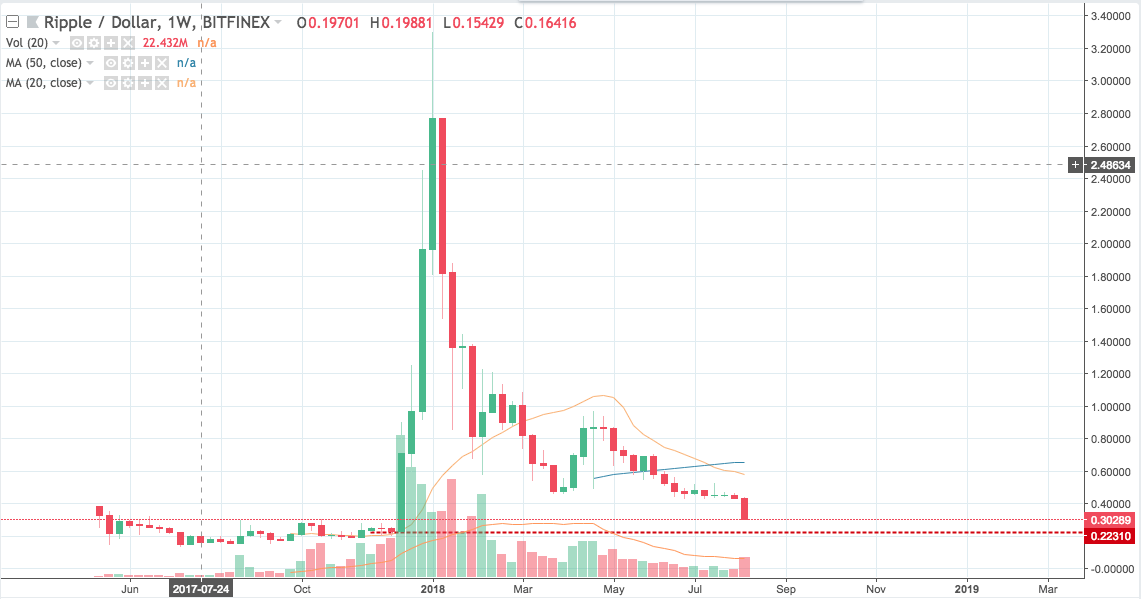
We think Ripple price can go below levels of $0.22 and give up all its gains since major bull rally of December last year. We shall wait for XRP chart to see any bullish signs before going long, till then we're not taking any trades on this pair. We'll be looking XRP to test lower line of Descending Triangle and sustain above 20-day Moving average as positive signs.
Disclaimer: Views expressed here are those of the author and aren’t an investment or trading advice. Trading involves risk and so do your due diligence before making a trading decision.

