


Ethereum (ETH) Price Predictions / Ethereum (ETH) Forecast
| After | Price | Change |
|---|---|---|
| 1 day | $205.6765 | 0.74% |
| 1 week | $205.7809 | 0.79% |
| 1 month | $205.7148 | 0.76% |
| 6 months | $309.5004 | 51.59% |
| 1 year | $466.1452 | 128.31% |
| 5 years | $1,605.5443 | 686.38% |
The Stochastic Oscillator is a range bound momentum oscillator. Stochastic oscillator is indicating Neutral action, with value at 35.4.
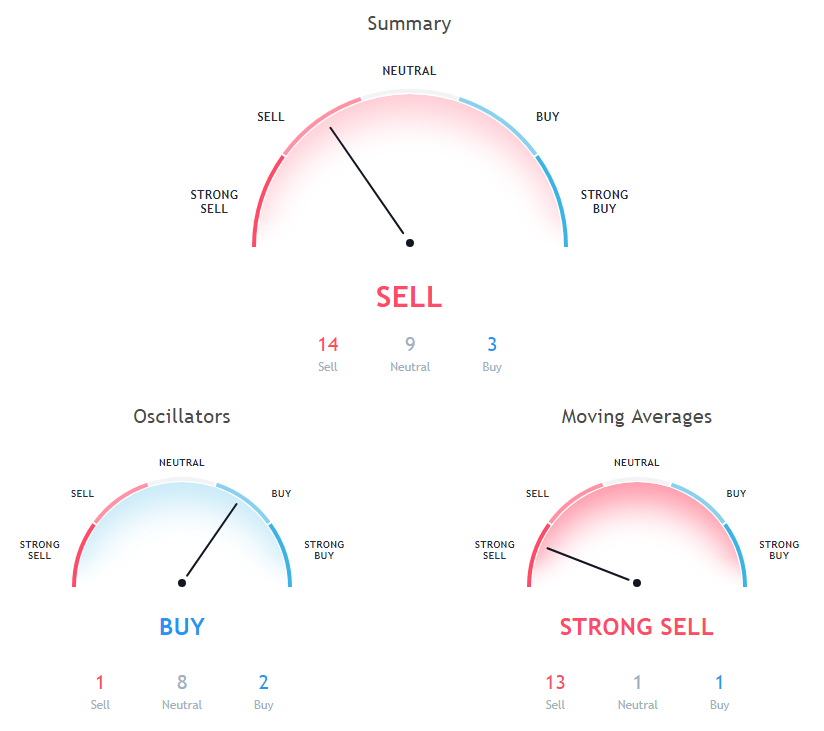
The Relative Strength Index (RSI) is an important indicator for measuring the speed and variation of price movements. Its value ranges from zero and 100. The value around 30 and below is considered an oversold region and over 70 as oversold regions. Relative Strength Index is indicating Neutral action, with value at 44.19.
The Commodity Channel Index (CCI) is a momentum oscillator used in technical analysis to measure an instrument's deviation from its statistical average. Commodity Channel Index is at -40.9, indicating Neutral action.
Moving Average (MA) is just average of any subset of numbers. For example, to calculate a basic 10-day moving average you would add up the closing prices from the past 10 days and then divide the result by 10.
100 days Simple Moving Average is indicating Sell since Ethereum is trading at $204.17, below MAs value of 293.83. 100 days Exponential Moving Average is indicating Sell since Ethereum is trading at $204.17, below MAs value of 293.31. 10 days Exponential Moving Average is indicating Sell since Ethereum is trading at $204.17, below MAs value of 208.8.
50 days Exponential Moving Average is indicating Sell action with value at 234.6, Ethereum is trading below it at $204.17. 20 days Exponential Moving Average is indicating Sell since Ethereum is trading at $204.17, below MAs value of 212.69. 9 days Ichimoku Cloud Base Line is at 215.49, showing Neutral signal, Ethereum is trading below it at $204.17.
30 days Simple Moving Average is indicating Sell action with value at 218.33, Ethereum is trading below it at $204.17. 10 days Simple Moving Average is indicating Sell action with value at 207.39, Ethereum is trading below it at $204.17. 200 days Exponential Moving Average is indicating Sell since Ethereum is trading at $204.17, below MAs value of 383.04.
9 days Hull Moving Average is indicating Buy since Ethereum is trading at $204.17, below MAs value of 206.22. 30 days Exponential Moving Average is indicating Sell action with value at 217.83, Ethereum is trading below it at $204.17. 200 days Simple Moving Average is indicating Sell action with value at 430.17, Ethereum is trading below it at $204.17.
Also Read: List of Places Accepting Ethereum
50 days Simple Moving Average is indicating Sell action with value at 218.91, Ethereum is trading below it at $204.17. 20 days Volume Weighted Moving Average is at 211.27, showing Sell signal, Ethereum is trading below it at $204.17. 20 days Simple Moving Average is indicating Sell since Ethereum is trading at $204.17, below MAs value of 213.54.
Other Technical Price Analysis for today:
Tron (TRX) Prices Still Remain Bullish - Tron Price Analysis - 22 Oct 2018

