


Bitcoin (BTC) Price Predictions / Bitcoin (BTC) Forecast
| After | Price | Change |
|---|---|---|
| 1 day | $6,540.9454 | 0.73% |
| 1 week | $6,549.1366 | 0.86% |
| 1 month | $6,517.9242 | 0.38% |
| 6 months | $7,069.5426 | 8.87% |
| 1 year | $9,367.7094 | 44.26% |
| 5 years | $24,102.4731 | 271.18% |
Relative Strength Index (RSI) is an important indicator that measures speed and change of price movements. Its value ranges between zero and 100. Value around 30 and below is considered oversold region and around 70 and above considered overbought regions. Relative Strength Index is showing Neutral signal, with value at 50.8.
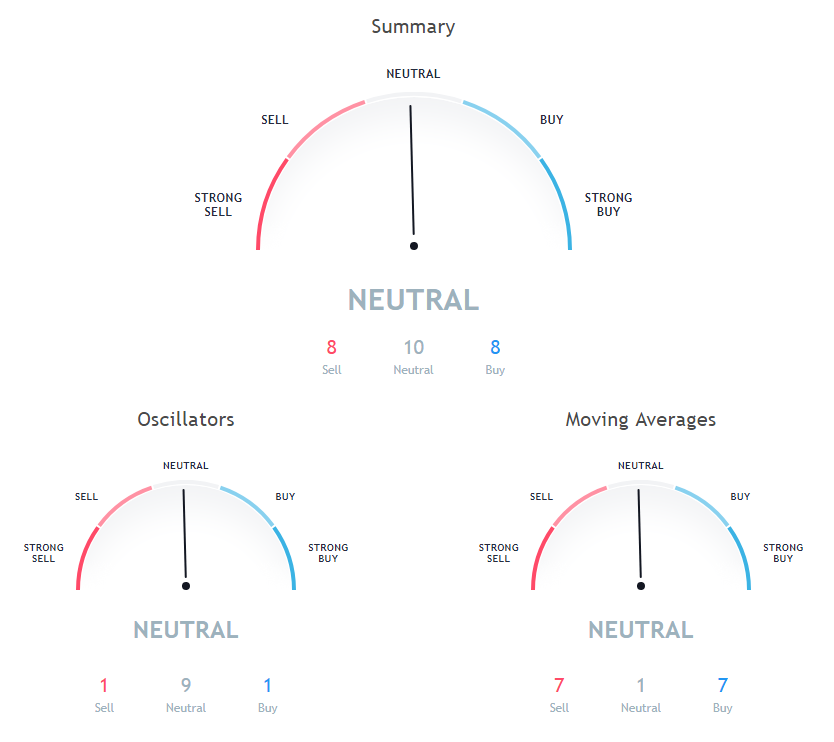
The Stochastic Oscillator is a range bound momentum oscillator. Stochastic oscillator is at 23.4, indicating Neutral action.
The Commodity Channel Index (CCI) is a momentum oscillator used in technical analysis to measure an instrument's deviation from its statistical average. Commodity Channel Index is indicating Neutral action, with value at 14.6.
50 days Simple Moving Average is indicating Buy action with value at 6553.2, Bitcoin is trading below it at $6493.51. 20 days Exponential Moving Average is indicating Buy action with value at 6571, Bitcoin is trading below it at $6493.51. 20 days Volume Weighted Moving Average is indicating Buy action with value at 6578.1, Bitcoin is trading below it at $6493.51.
9 days Hull Moving Average is indicating Buy since Bitcoin is trading at $6493.51, below MAs value of 6556.3. 100 days Exponential Moving Average is indicating Sell action with value at 6769.5, Bitcoin is trading below it at $6493.51. 30 days Simple Moving Average is at 6570.6, showing Buy signal, Bitcoin is trading below it at $6493.51.
10 days Exponential Moving Average is indicating Buy action with value at 6580.8, Bitcoin is trading below it at $6493.51. 9 days Ichimoku Cloud Base Line is indicating Neutral since Bitcoin is trading at $6493.51, below MAs value of 7004.2. 100 days Simple Moving Average is indicating Sell since Bitcoin is trading at $6493.51, below MAs value of 6793.7.
50 days Exponential Moving Average is at 6601.9, showing Sell signal, Bitcoin is trading below it at $6493.51. 200 days Exponential Moving Average is indicating Sell since Bitcoin is trading at $6493.51, below MAs value of 7160.2. 30 days Exponential Moving Average is indicating Buy since Bitcoin is trading at $6493.51, below MAs value of 6573.2.
Also Read: A to Z of Bitcoins
10 days Simple Moving Average is indicating Buy since Bitcoin is trading at $6493.51, below MAs value of 6579.3. 200 days Simple Moving Average is indicating Sell since Bitcoin is trading at $6493.51, below MAs value of 7201.1. 20 days Simple Moving Average is indicating Buy since Bitcoin is trading at $6493.51, below MAs value of 6562.
Other Technical Price Analysis for today:
Tron (TRX) Prices Still Remain Bullish - Tron Price Analysis - 22 Oct 2018

