


Ethereum (ETH) Price Predictions / Ethereum (ETH) Forecast
| After | Price | Change |
|---|---|---|
| 1 day | $155.5809 | 0.45% |
| 1 week | $156.6421 | 1.14% |
| 1 month | $177.7114 | 14.74% |
| 6 months | $258.9646 | 67.20% |
| 1 year | $448.3371 | 189.47% |
| 5 years | $1,561.2530 | 908.04% |
The Stochastic Oscillator is a range bound momentum oscillator. Stochastic oscillator is showing Neutral signal, with value at 8.48.
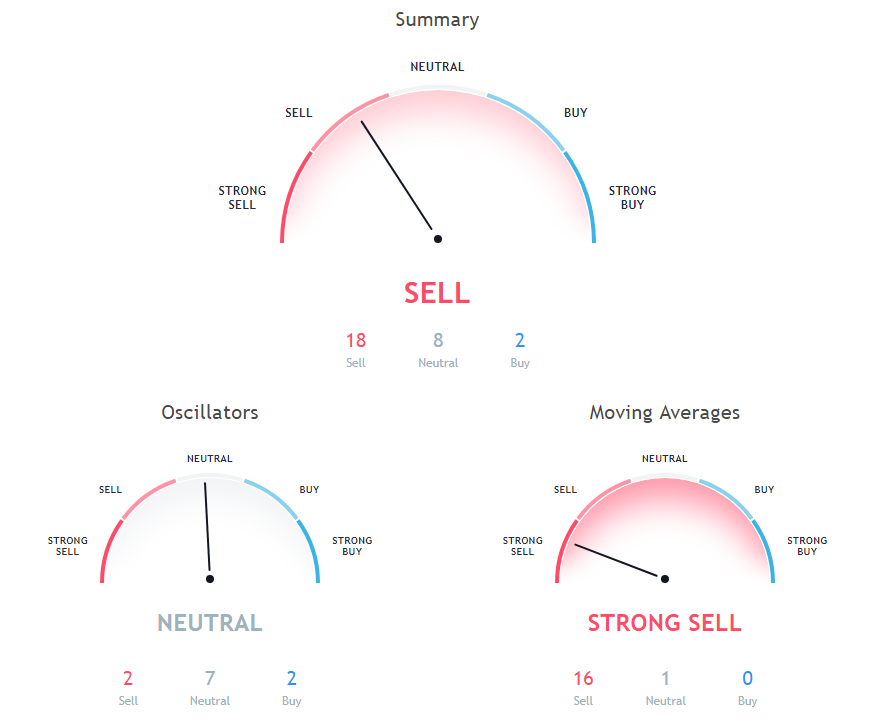
The Commodity Channel Index (CCI) is a momentum-based technical trading tool used to determine when a market is overbought or oversold. Commodity Channel Index is indicating Neutral action, with value at -207.22.
Relative Strength Index (RSI) is an important indicator that measures speed and change of price movements. Its value ranges between zero and 100. Value around 30 and below is considered oversold region and around 70 and above considered overbought regions. Relative Strength Index is at 22.25, indicating Buy action.
Moving Average (MA) is just average of any subset of numbers. For example, to calculate a basic 10-day moving average you would add up the closing prices from the past 10 days and then divide the result by 10.
5 days Simple Moving Average is indicating Sell action with value at 174.41, Ethereum is trading below it at $154.88. 200 days Simple Moving Average is at 379.14, showing Sell signal, Ethereum is trading below it at $154.88. 30 days Simple Moving Average is indicating Sell action with value at 201.09, Ethereum is trading below it at $154.88.
200 days Exponential Moving Average is indicating Sell action with value at 338.36, Ethereum is trading below it at $154.88. 10 days Exponential Moving Average is at 184.89, showing Sell signal, Ethereum is trading below it at $154.88. 9 days Ichimoku Cloud Base Line is at 189.61, showing Neutral signal, Ethereum is trading below it at $154.88.
10 days Simple Moving Average is indicating Sell action with value at 190.8, Ethereum is trading below it at $154.88. 50 days Simple Moving Average is indicating Sell action with value at 206.93, Ethereum is trading below it at $154.88. 100 days Simple Moving Average is indicating Sell action with value at 228.84, Ethereum is trading below it at $154.88.
50 days Exponential Moving Average is at 209.98, showing Sell signal, Ethereum is trading below it at $154.88. 9 days Hull Moving Average is indicating Sell action with value at 163.68, Ethereum is trading below it at $154.88. 20 days Exponential Moving Average is indicating Sell action with value at 194.28, Ethereum is trading below it at $154.88.
100 days Exponential Moving Average is indicating Sell action with value at 253.07, Ethereum is trading below it at $154.88. 20 days Volume Weighted Moving Average is indicating Sell action with value at 193.01, Ethereum is trading below it at $154.88. 5 days Exponential Moving Average is indicating Sell since Ethereum is trading at $154.88, below MAs value of 174.28.
Also Read: How to Mine Ethereum?
30 days Exponential Moving Average is at 199.33, showing Sell signal, Ethereum is trading below it at $154.88. 20 days Simple Moving Average is indicating Sell action with value at 199.78, Ethereum is trading below it at $154.88.
Other Technical Price Analysis for today:
Bitcoin Cash (BCH) Price May Break Below $300 Support - Bitcoin Cash Price Analysis - 19 Nov 2018
Cardano (ADA) Price Fell Significantly Recently - Cardano Price Analysis - 19 Nov 2018

