


Ethereum (ETH) Price Predictions / Ethereum (ETH) Forecast
| After | Price | Change |
|---|---|---|
| 1 day | $207.2629 | 0.09% |
| 1 week | $210.8319 | 1.82% |
| 1 month | $209.0696 | 0.97% |
| 6 months | $312.8349 | 51.08% |
| 1 year | $468.2606 | 126.14% |
| 5 years | $1,611.2384 | 678.11% |
Relative Strength Index (RSI) is an important indicator that measures speed and change of price movements. Its value ranges between zero and 100. Value around 30 and below is considered oversold region and around 70 and above considered overbought regions. Relative Strength Index is showing Neutral signal, with value at 45.87.
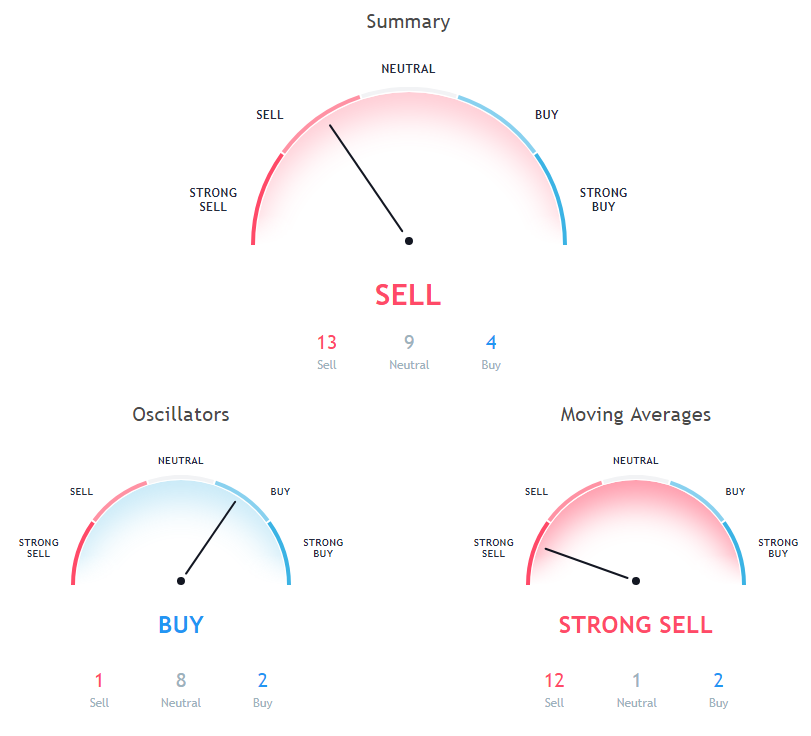
The Commodity Channel Index (CCI) is a momentum-based technical trading tool used to determine when a market is overbought or oversold. Commodity Channel Index is at -39.7, indicating Neutral action.
The Stochastic Oscillator is a range bound momentum oscillator. Stochastic oscillator is indicating Neutral action, with value at 46.08.
Moving Average (MA) in simple term is just average of any subset of numbers. For example, 50 Days simple moving average is calculated at any point in chart by summing past 50 days of price and then dividing it by 50.
50 days Exponential Moving Average is at 239.64, showing Sell signal, Ethereum is trading below it at $207.07. 10 days Exponential Moving Average is indicating Buy since Ethereum is trading at $207.07, below MAs value of 212.07. 200 days Exponential Moving Average is at 390.29, showing Sell signal, Ethereum is trading below it at $207.07.
200 days Simple Moving Average is indicating Sell action with value at 433.86, Ethereum is trading below it at $207.07. 20 days Simple Moving Average is indicating Sell since Ethereum is trading at $207.07, below MAs value of 218.56. 9 days Ichimoku Cloud Base Line is indicating Neutral since Ethereum is trading at $207.07, below MAs value of 219.02.
50 days Simple Moving Average is indicating Sell action with value at 225.61, Ethereum is trading below it at $207.07. 30 days Simple Moving Average is indicating Sell action with value at 221.73, Ethereum is trading below it at $207.07. 10 days Simple Moving Average is indicating Buy since Ethereum is trading at $207.07, below MAs value of 209.58.
20 days Volume Weighted Moving Average is indicating Sell since Ethereum is trading at $207.07, below MAs value of 216.2. 100 days Simple Moving Average is indicating Sell since Ethereum is trading at $207.07, below MAs value of 303.03. 20 days Exponential Moving Average is at 216.08, showing Sell signal, Ethereum is trading below it at $207.07.
Also Read: 10 Best Ethereum Wallets of 2018
9 days Hull Moving Average is at 216.18, showing Sell signal, Ethereum is trading below it at $207.07. 100 days Exponential Moving Average is indicating Sell action with value at 300.63, Ethereum is trading below it at $207.07. 30 days Exponential Moving Average is indicating Sell action with value at 221.54, Ethereum is trading below it at $207.07.
Other Technical Price Analysis for today:
Ripple (XRP) Price Trades With A Bullish Bias Above $0.4600 - Ripple Price Analysis - 18 Oct 2018

