


Bitcoin (BTC) Price Predictions / Bitcoin (BTC) Forecast
| After | Price | Change |
|---|---|---|
| 1 day | $6,597.5332 | 0.58% |
| 1 week | $6,605.3513 | 0.70% |
| 1 month | $6,583.2971 | 0.36% |
| 6 months | $7,157.6768 | 9.12% |
| 1 year | $9,439.5793 | 43.90% |
| 5 years | $24,147.1579 | 268.11% |
The Commodity Channel Index (CCI) is a momentum-based technical trading tool used to determine when a market is overbought or oversold. Commodity Channel Index is at 84.4, indicating Neutral action.
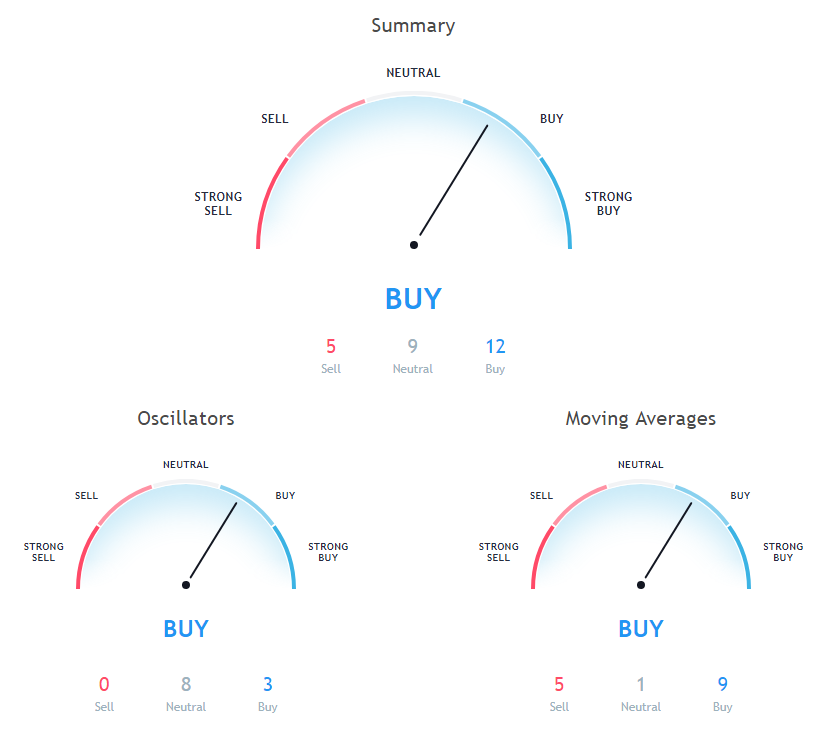
Relative Strength Index (RSI) is an important indicator that measures speed and change of price movements. Its value ranges between zero and 100. Value around 30 and below is considered oversold region and around 70 and above considered overbought regions. Relative Strength Index is at 56.5, indicating Neutral action.
The stochastic oscillator is a momentum indicator that compares the closing price of a security with the price range over a specific period. Stochastic oscillator is at 33, indicating Neutral action.
Moving averages come in many forms, but their use remains the same: to help traders identify the trends of assets by smoothing out the day-to-day price fluctuations.
20 days Exponential Moving Average is indicating Buy since Bitcoin is trading at $6559.73, below MAs value of 6580. 10 days Simple Moving Average is indicating Buy action with value at 6545.3, Bitcoin is trading below it at $6559.73. 50 days Simple Moving Average is indicating Buy since Bitcoin is trading at $6559.73, below MAs value of 6599.6.
50 days Exponential Moving Average is indicating Buy since Bitcoin is trading at $6559.73, below MAs value of 6611.4. 200 days Exponential Moving Average is at 7185.3, showing Sell signal, Bitcoin is trading below it at $6559.73. 200 days Simple Moving Average is at 7210.3, showing Sell signal, Bitcoin is trading below it at $6559.73.
10 days Exponential Moving Average is at 6606.6, showing Buy signal, Bitcoin is trading below it at $6559.73. 9 days Hull Moving Average is indicating Sell since Bitcoin is trading at $6559.73, below MAs value of 6835.1. 30 days Exponential Moving Average is at 6580.3, showing Buy signal, Bitcoin is trading below it at $6559.73.
20 days Volume Weighted Moving Average is indicating Buy action with value at 6581.7, Bitcoin is trading below it at $6559.73. 100 days Exponential Moving Average is at 6788.1, showing Sell signal, Bitcoin is trading below it at $6559.73. 30 days Simple Moving Average is at 6577, showing Buy signal, Bitcoin is trading below it at $6559.73.
Also Read: Everything you need to know about Bitcoin ETF
9 days Ichimoku Cloud Base Line is at 7004.2, showing Neutral signal, Bitcoin is trading below it at $6559.73. 20 days Simple Moving Average is indicating Buy since Bitcoin is trading at $6559.73, below MAs value of 6570.7. 100 days Simple Moving Average is at 6782.9, showing Sell signal, Bitcoin is trading below it at $6559.73.
Other Technical Price Analysis for today:
Ripple (XRP) Price Trades With A Bullish Bias Above $0.4600 - Ripple Price Analysis - 18 Oct 2018
Ethereum (ETH) Price Likely To Remain In Range Around $202 - Ethereum Price Analysis - 18 Oct 2018

