


Technical analysis is done by analyzing data gathered from historical trading activity, such as volume, price movement, open, close etc.
Ethereum (ETH) Price Predictions / Ethereum (ETH) Forecast
| After | Price | Change |
|---|---|---|
| 1 day | $227.3987 | 0.37% |
| 1 week | $229.6467 | 1.37% |
| 1 month | $229.0671 | 1.11% |
| 6 months | $327.4625 | 44.54% |
| 1 year | $484.2047 | 113.73% |
| 5 years | $1,638.2782 | 623.14% |
We've applied Technical Analysis to the price of Ethereum (ETH/USD) for today and predict where price is headed.
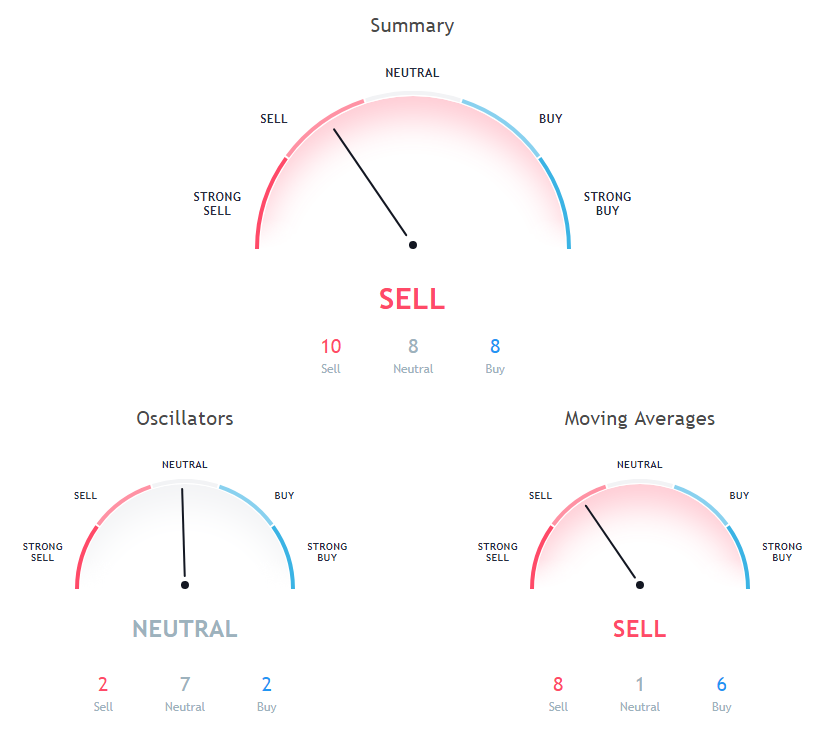
Relative Strength Index (RSI) is an important indicator that measures speed and change of price movements. Its value ranges between zero and 100. Value around 30 and below is considered oversold region and around 70 and above considered overbought regions. Relative Strength Index is indicating Neutral action, with value at 47.97.
The stochastic oscillator is a momentum indicator that compares the closing price of a security with the price range over a specific period. Stochastic oscillator is indicating Neutral action, with value at 46.88.
The Commodity Channel Index (CCI) is a momentum-based technical trading tool used to determine when a market is overbought or oversold. Commodity Channel Index is at 15.07, indicating Neutral action.
200 days Simple Moving Average is at 449.16, showing Sell signal, Ethereum is trading below it at $226.55. 10 days Exponential Moving Average is indicating Buy action with value at 226.31, Ethereum is trading below it at $226.55. 20 days Exponential Moving Average is at 227.47, showing Sell signal, Ethereum is trading below it at $226.55.
100 days Simple Moving Average is indicating Sell action with value at 333.15, Ethereum is trading below it at $226.55. 9 days Hull Moving Average is at 224.02, showing Buy signal, Ethereum is trading below it at $226.55. 50 days Simple Moving Average is indicating Sell since Ethereum is trading at $226.55, below MAs value of 242.55.
20 days Volume Weighted Moving Average is indicating Buy since Ethereum is trading at $226.55, below MAs value of 222.22. 10 days Simple Moving Average is indicating Buy since Ethereum is trading at $226.55, below MAs value of 227.2. 100 days Exponential Moving Average is at 324.62, showing Sell signal, Ethereum is trading below it at $226.55.
200 days Exponential Moving Average is at 412.98, showing Sell signal, Ethereum is trading below it at $226.55. 20 days Simple Moving Average is at 225.31, showing Buy signal, Ethereum is trading below it at $226.55. 9 days Ichimoku Cloud Base Line is indicating Neutral action with value at 211.16, Ethereum is trading below it at $226.55.
Also Read: 10 Best Ethereum Wallets of 2018
30 days Exponential Moving Average is at 233.81, showing Sell signal, Ethereum is trading below it at $226.55. 30 days Simple Moving Average is at 218.03, showing Buy signal, Ethereum is trading below it at $226.55. 50 days Exponential Moving Average is indicating Sell since Ethereum is trading at $226.55, below MAs value of 256.74.
Other Technical Price Analysis for today:
Litecoin (LTC) Moves Towards $64 Mark - Litcoin Price Analysis - 6 Oct 2018

