


Bitcoin (BTC) Price Predictions / Bitcoin (BTC) Forecast
| After | Price | Change |
|---|---|---|
| 1 day | $6,538.4576 | 0.83% |
| 1 week | $6,600.7673 | 1.79% |
| 1 month | $6,509.5251 | 0.39% |
| 6 months | $7,080.2958 | 9.19% |
| 1 year | $9,363.5659 | 44.40% |
| 5 years | $24,078.2957 | 271.32% |
The Relative Strength Index (RSI) is an important indicator for measuring the speed and variation of price movements. Its value ranges from zero and 100. The value around 30 and below is considered an oversold region and over 70 as oversold regions. Relative Strength Index is at 51.3, indicating Neutral action.
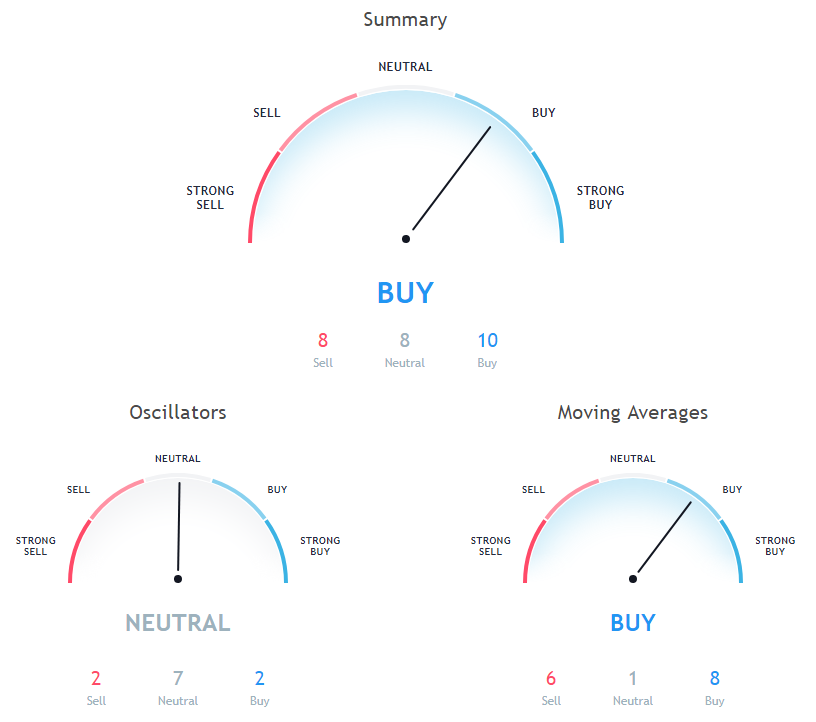
The stochastic oscillator is a momentum indicator that compares the closing price of a security with the price range over a specific period. Stochastic oscillator is at 27.5, indicating Neutral action.
The Commodity Channel Index (CCI) is a momentum-based technical trading tool used to determine when a market is overbought or oversold. Commodity Channel Index is indicating Neutral action, with value at 21.8.
20 days Exponential Moving Average is indicating Buy since Bitcoin is trading at $6484.44, below MAs value of 6573. 100 days Simple Moving Average is indicating Sell action with value at 6784.1, Bitcoin is trading below it at $6484.44. 10 days Simple Moving Average is indicating Buy action with value at 6528.6, Bitcoin is trading below it at $6484.44.
20 days Volume Weighted Moving Average is at 6580.2, showing Buy signal, Bitcoin is trading below it at $6484.44. 30 days Exponential Moving Average is indicating Buy action with value at 6575.3, Bitcoin is trading below it at $6484.44. 30 days Simple Moving Average is at 6580.5, showing Buy signal, Bitcoin is trading below it at $6484.44.
9 days Hull Moving Average is indicating Sell action with value at 6756.7, Bitcoin is trading below it at $6484.44. 100 days Exponential Moving Average is indicating Sell action with value at 6782.4, Bitcoin is trading below it at $6484.44. 10 days Exponential Moving Average is indicating Buy since Bitcoin is trading at $6484.44, below MAs value of 6590.
20 days Simple Moving Average is at 6565.6, showing Buy signal, Bitcoin is trading below it at $6484.44. 9 days Ichimoku Cloud Base Line is at 7004.2, showing Neutral signal, Bitcoin is trading below it at $6484.44. 200 days Exponential Moving Average is indicating Sell since Bitcoin is trading at $6484.44, below MAs value of 7178.4.
Also Read: Bitcoin Mining Pools
200 days Simple Moving Average is indicating Sell since Bitcoin is trading at $6484.44, below MAs value of 7207.5. 50 days Simple Moving Average is indicating Buy since Bitcoin is trading at $6484.44, below MAs value of 6589.8. 50 days Exponential Moving Average is indicating Sell since Bitcoin is trading at $6484.44, below MAs value of 6607.
Other Technical Price Analysis for today:
Tron (TRX) Price Remains Constant With Lack Of Momentum - Tron Price Analysis - 19 Oct 2018

